
Irrigated Corn Research
- Ask Extension
- Health & Well-being
-
Agricultural Programs
- Agribusiness
- Animal Science
- Beginning Farmer Program
- Commercial Crops
- Delaware Soil Testing Program
- Disease Management
- Farm Vitality and Health Project
- Irrigation
- Nutrient Management
-
Insect Pest Management
- Insect Trapping Program
- IPM Hot Topics
- Commercial Field Crop Insect Management
- Commercial Field Crop Disease Management
- Commercial Fruit & Vegetable Crop Pest Management
- EIPM Implementation Projects
- Pollinators
- Research and Extension Demonstration Results
- Brown Marmorated Stink Bug (BMSB) Management, Research, and Resources
- Publications
- Pesticide Safety Education Program
- UD Plant Diagnostic Clinic
- Variety Trials
- Weed Science
- Certified Crop Advisor Program
- Poultry Biosecurity
- 4-H
- Horticulture
Research
One of the first tasks assigned to the irrigation research team by Delaware farmers was to answer the decades old question of how to best irrigate corn on sandy soils for maximum yield. Our initial research began using an evapotranspiration (ET) based schedule to determine when the crop should be irrigated, and looked at applying the water in varying amount per application. The application rates during peak water use were 0.33″ per day vs. 0.66″ every other day vs. 1′ every three days. The results of the initial work was rather inconclusive as soil type appeared to make more of a difference than application method. At this point, it became obvious to begin looking at varying amounts of irrigation across a range of soil types.

Summer study
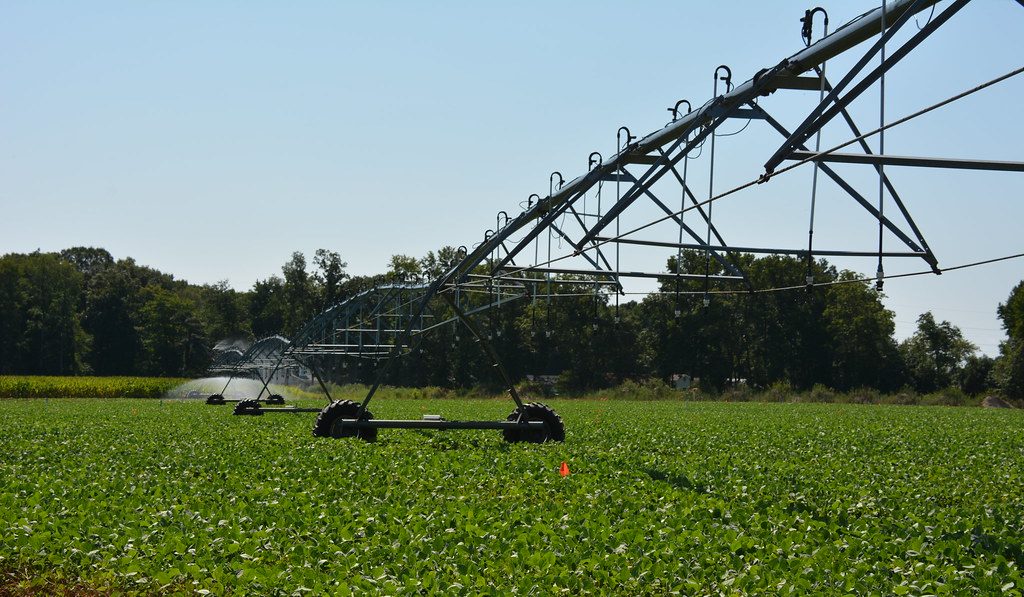
For the Summer 2012 study, we were fortunate enough to acquire a variable rate irrigation control for the four tower center pivot located at the Warrington Farm. This controller permits the individual control of each nozzle on the pivot (85 in all) based on field location. With this new equipment capability, we are now able to apply very specific irrigation amounts to to relatively small (100′-200′ x 60′) plots.
The field was then divided into five “tiers” of ranked (20% wettest/heaviest soil, 20% driest/lightest soil and three intermediate levels) soil types based on historical aerial images. These tiers were used as the five individual replications of each irrigation treatment.
Within each soil type tier, 9 irrigation treatments were maintained throughout the season. The treatments included:
- Evapotranspiration based schedule using a 50% managed allowable depletion.
- Soil moisture triggered at 20 centibars for the full season.
- Soil moisture triggered at 30 centibars for the full season.
- Soil moisture triggered at 40 centibars for the full season.
- Soil moisture triggered at 50 centibars for the full season.
- Soil moisture triggered at 20 cb from emergence to V16; 40 cb from V16 to R3; and 20 cb from R3 to maturity.
- Soil moisture triggered at 40 cb from emergence to V16; 20 cb from V16 to R3; and 40 cb from R3 to maturity.
- Soil moisture triggered at 30 cb until R5.
- Soil moisture triggered at 30 centibars until half milkline.
Soil moisture levels
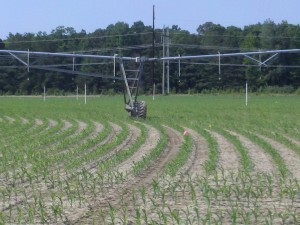
All of the plots were planted with a Kinze 3660 12 row 30″ vaccum planter at using Dekalb 63-14 at 34,000 seeds per acre. Three tons/acre of broiler litter and 90lbs/acre of Potash (0-0-60) was applied prior to chisel plowing the field. An additional 35 lbs of nitrogen was applied in a 2″ x 2″ band at planting followed by a 50 lbs/acre sidedress application and 3-25 lbs/acre applications through the irrigation system (fertigation).
The soil moisture levels in each of the 45 plots will be continuously monitored by a Watermark 950T (Irrometer Co. Riverside, CA) wireless soil moisture monitoring transmitter. Each transmitter will collect soil matric potential values from three Watermark matric potential sensors placed at 6″, 12″, and 18″ and transmit the data to a central logger approximately 15 times per day. For each treatment, irrigation will be initiated when soil moisture at 6″ reaches a specific threshold soil matric potential. Soil matric potential at the 12″ and 18″ depths will determine the volume of irrigation applied.
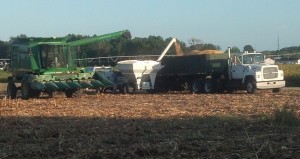
The volume of water applied to each plot was recorded and summed over the whole season and during each applicable growth period (as outlined for treatments 5-8). Corn grain was harvested from each plot at maturity. Grain yield from each plot was determined using a weigh wagon and the on-board combine yield monitor. Grain weight was adjusted for moisture content prior to analysis. Data is currently being analyzed using appropriate statistical methods to determine the effects of irrigation schedules on the amount of water applied and grain yield. Results from this study will be used to adjust UD soil matric potential recommendations for irrigation management with the results of the first year of study becoming available in January.
The University of Delaware is an Equal Opportunity Institution and Provider. Visit UD’s Office of Civil Rights and Title IX Compliance to learn more.
Additional Links
531 South College Avenue Newark, DE 19716 (302) 831-2501