



Fact Sheets And Publications
Using Apparent Electrical Conductivity to Map Coastal Salinity
February 2026 | Written by: Jarrod Miller, Sapana Pohkrel, & Amy Shober

Invisible Effects of Coastal Salinity
Coastal salinity is an increasing challenge in low-lying agricultural landscapes. Saltwater inundation (SWI) from tidal flooding can create obvious dead zones along field edges, but these visible areas represent only the most severe damage. Across much larger portions of a field, salts may quietly reduce yields without clear symptoms, and by the time crops appear yellow or stunted, significant yield loss has already occurred. To manage salinity proactively, growers need tools that detect subsurface salt accumulation early. Soil sensing technologies that measure electrical conductivity make it possible to map root zone conditions across an entire field without relying on hundreds of soil samples.
What is Apparent Electrical Conductivity (ECa)
Apparent electrical conductivity (ECa) measures how easily an electrical current moves through the soil and reflects several fundamental soil properties. It is influenced by soil texture, moisture content, organic matter, and the concentration of dissolved ions in the soil solution. Finer-textured soils and wetter conditions generally increase conductivity, as do higher levels of organic matter and dissolved salts. Because ECa integrates these factors, it has long been used to identify differences in soil texture, drainage, and water-holding capacity across fields. In arid regions, ECa mapping is also commonly used to assess soil salinity. However, ECa does not measure a single property directly, so maps must be interpreted carefully and supported by soil sampling to determine which factors are driving conductivity patterns in a given field.
Mapping Salinity Patterns Across Coastal Fields
In most fields, ECa mapping is conducted with a tractor-mounted, on-the-go conductivity sensor such as a Veris system. These sensors place discs in contact with the soil and measure electrical conductivity continuously as the equipment is pulled across the field. They may take both shallow (0-1 foot) and deep (0-3 foot) measurements Figure 2). Data are typically collected along parallel transects, producing dense, high-resolution maps of subsurface variability.

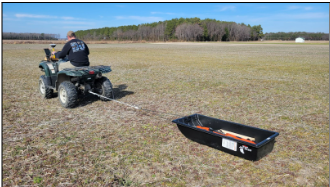
In low-lying coastal fields that have excessively wet soils or recent flooding can limit tractor access. Under these conditions, ECa can be measured using a non-contact electromagnetic induction (EMI) sensor, such as an EM38. The EM38 is typically mounted on a sled or small platform and pulled behind an all-terrain vehicle, minimizing soil disturbance and compaction (Figure 3). Rather than relying on direct soil contact, the EM38 induces an electromagnetic field and measures the soil’s response, which is influenced by the same soil properties that affect ECa, including moisture, texture, and dissolved salts.
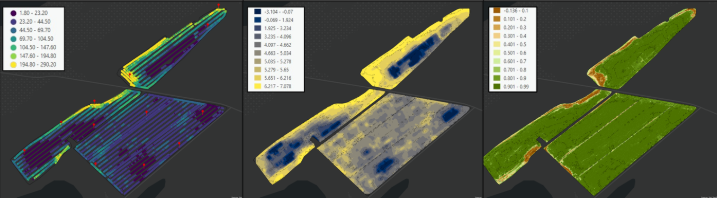
Regardless of the platform used, the resulting ECa maps reveal spatial patterns that are often invisible at the soil surface. These maps commonly show distinct zones of low, moderate, and high conductivity, which serve as an initial indicator of where salinity or other soil constraints may be influencing crop performance (Figure 4a). When combined with elevation and soil sampling data, these patterns provide a powerful framework for understanding salinity distribution across coastal fields.
Linking ECa to Measured Soil Salinity
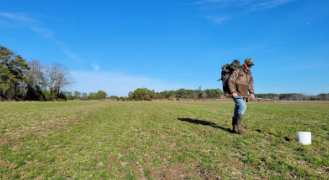
To ensure ECa maps accurately represent actual soil conditions, targeted soil sampling is conducted across the full range of observed ECa values (Figure 5). Instead of relying on random sampling, specific locations are intentionally selected to capture the conductivity gradient, from low to high ECa zones. One commonly used approach for selecting these sampling points is the USDA‑ARS ESAP (Electrical Conductivity Sampling, Assessment, and Prediction) software, which identifies the minimum number of locations that best represent field-scale variability.
Soil samples collected from these locations are analyzed for salinity-related indicators, including saturated paste electrical conductivity and soil test sodium (Na). By correlating laboratory measurements to ECa values, site-specific relationships are developed between ECa and soil salinity indicators. These relationships allow ECa maps to be converted into estimated salinity maps that more accurately reflect conditions within the crop root zone (Figure 4b). Using spatial interpolation techniques, these datapoints are converted into continuous field-scale maps that highlight areas most likely to experience yield loss or long-term soil degradation.
In fields affected by inundation of salts, soil Na typically shows the strongest and most consistent relationship with ECa, allowing linear relationships between Na and ECa to be used to estimate sodium concentrations across the field (Figure 4b).
Integrating Drone Imagery with ECa Mapping
Yield maps, drone or satellite based imagery provides a complementary, above-ground perspective on how soil salinity affects crop performance. Multispectral drone imagery collected during the growing season can be used to calculate vegetation indices such as the Normalized Difference Vegetation Index (NDVI), which reflect crop vigor, canopy density, and stress. When overlaid with ECa- and salinity-derived maps, drone imagery helps distinguish areas where elevated subsurface salinity is already translating into visible crop stress from areas where salts are present but impacts have not yet emerged (Figure 4c). This integration is particularly valuable in coastal systems, where salinity effects may lag behind flooding events or develop gradually over multiple seasons.
Key Takeaway
Apparent electrical conductivity mapping is a practical and scalable tool for understanding and managing coastal salinity. As it assists farmers, consultants, and land managers to make informed decisions before crop stress becomes visible by:
Identify hidden risks: ECa mapping reveals salt gradients that are not visible to the naked eye.
Improve precision: Directed soil sampling based on ECa maps is more accurate and cost-effective than grid sampling for salinity.
Proactive planning: Combining ECa with elevation data helps predict which areas of a field are most vulnerable to future SWI.
This outreach was supported by USDA-NIFA: 2022-68008-36647.
References
Pokhrel, S, Blew, W., Miller, J.O., and Shober, A.L. (2025). Evaluating routine agronomic soil tests for coastal soil salinity detection in the Mid-Atlantic, Soil Science Society of America Journal, 89, e70075. https://doi.org/10.1002/saj2.70075
UD Cooperative Extension
This institution is an equal opportunity provider.
In accordance with Federal law and U.S. Department of Agriculture policy, Cooperative Extension is prohibited from discriminating on the basis of race, color, national origin, sex, age, or disability.