
Category: Cooperative Extension
Weather-Based Tools to Help Delaware Farmers Make Management Decisions
March 25, 2024 Written by Emmalea Ernest, Phd, Extension Fruit and Vegetable Specialist, Assistant Professor, Department of Plant & Soil Sciences
Delaware has a dense network of weather stations that is maintained by Delaware Environmental Observing System (DEOS). The weather data from DEOS stations is publicly available through the DEOS website (deos.udel.edu). The DEOS home page is a great resource for quickly checking temperature, wind speed, rainfall totals, and radar and satellite loops for Delaware (Figure 1.). I personally use the DEOS home page almost every day during the growing season to check rainfall totals and temperatures and to dodge thunderstorms as I plan (and replan) the day’s fieldwork.
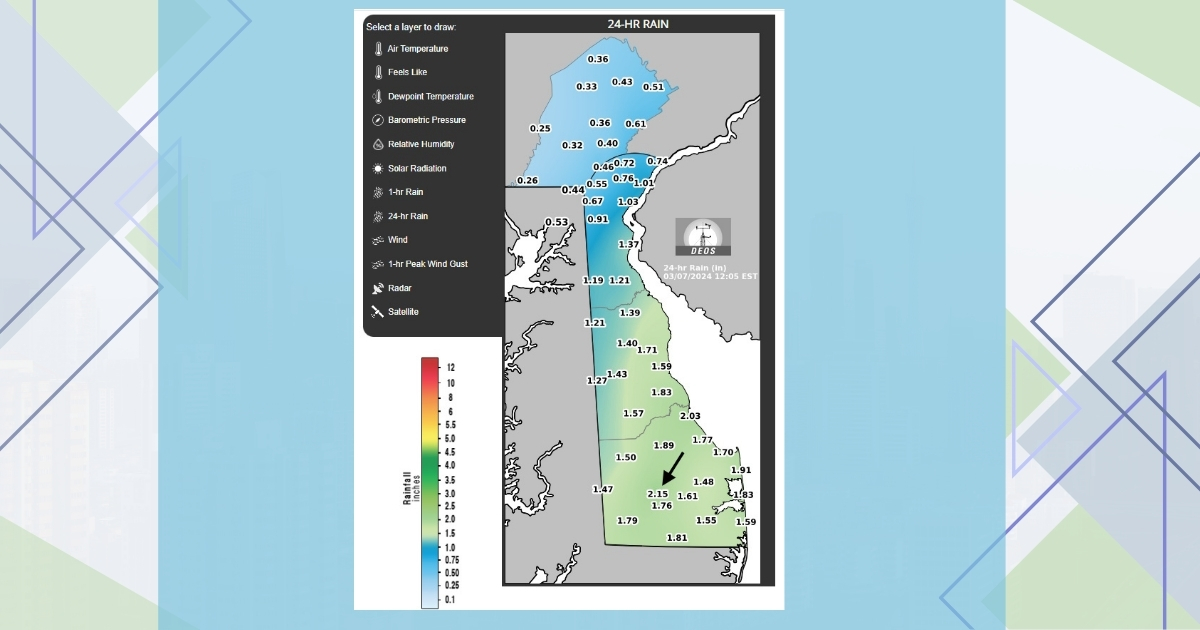
Figure 1. On March 7, 2024, the DEOS 24-hour rainfall map indicates that we got 2.15 inches at the Georgetown research farm and rainfall amounts were higher in southern Delaware.
DEOS Data Services
Almost 20 years of historical weather data from the DEOS system is available through the DEOS Data Services page https://deos.udel.edu/data/. This data can be useful when trying to understand how weather conditions may have impacted crop performance. In Figure 2, I plotted the daily high and low temperatures for the period when I was growing watermelons in 2023, as well as the 10-year average high and low temperatures. Obviously, temperatures were much lower than average during the beginning of the growing season, which helped to explain the delayed harvest that I observed.
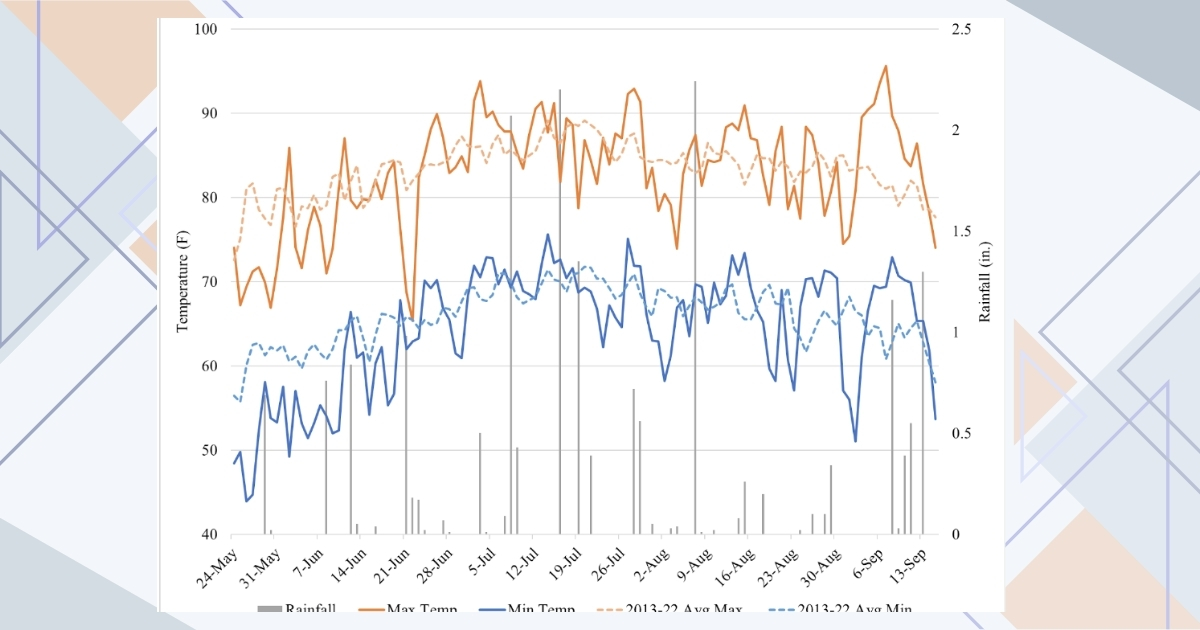
Figure 2. Season-long weather summary from the 2023 seedless watermelon variety trial.
Climate Smart Farming Growing Degree Day (GDD) Calculator
If you don’t have time to create your own temperature charts, the Climate Smart Farming Growing Degree Day (GDD) Calculator from Cornell University (http://climatesmartfarming.org/tools/csf-growing-degree-day-calculator/) is another tool that can help you determine whether the current season’s temperatures are a lot different than past seasons. In Figure 3, note that the 2023 season’s GDD accumulation (green line) is lower than what is typical for the past 15 (blue line) and 30 (purple line) year averages in the month of June. GDD accumulation remains below the 15-year average through the end of the 2023 watermelon production season.
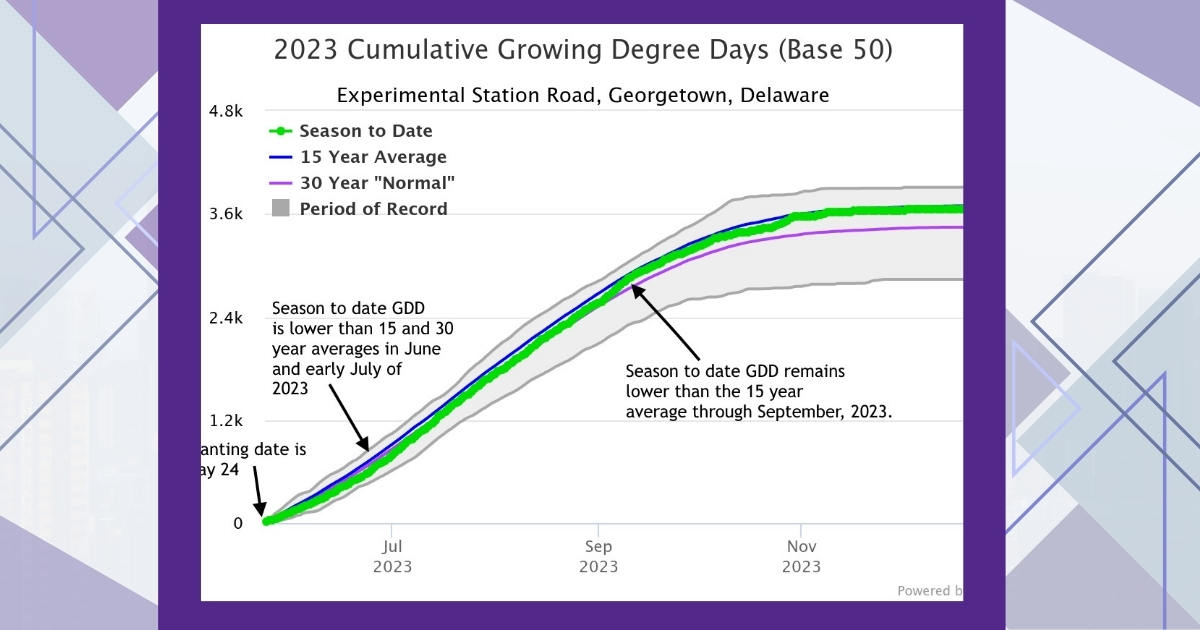
Figure 3. Comparing the observed GDD accumulation in 2023 to historical averages from the past 15 or 30 years using the Climate Smart Farming GDD Calculator.
The Climate Smart Farming GDD Calculator can also be used to predict maturity dates for crops based on the 15 and 30-year average GDD accumulations. Figure 4 shows the base 40 GDD accumulation starting on April 1. If I plant peas on that date, I can expect a 1200 GDD variety to mature around May 29 and a 1600 GDD variety to mature around June 10. This tool can also be used at the end of the growing season, to determine if late plantings are likely to accumulate enough GDDs to mature.
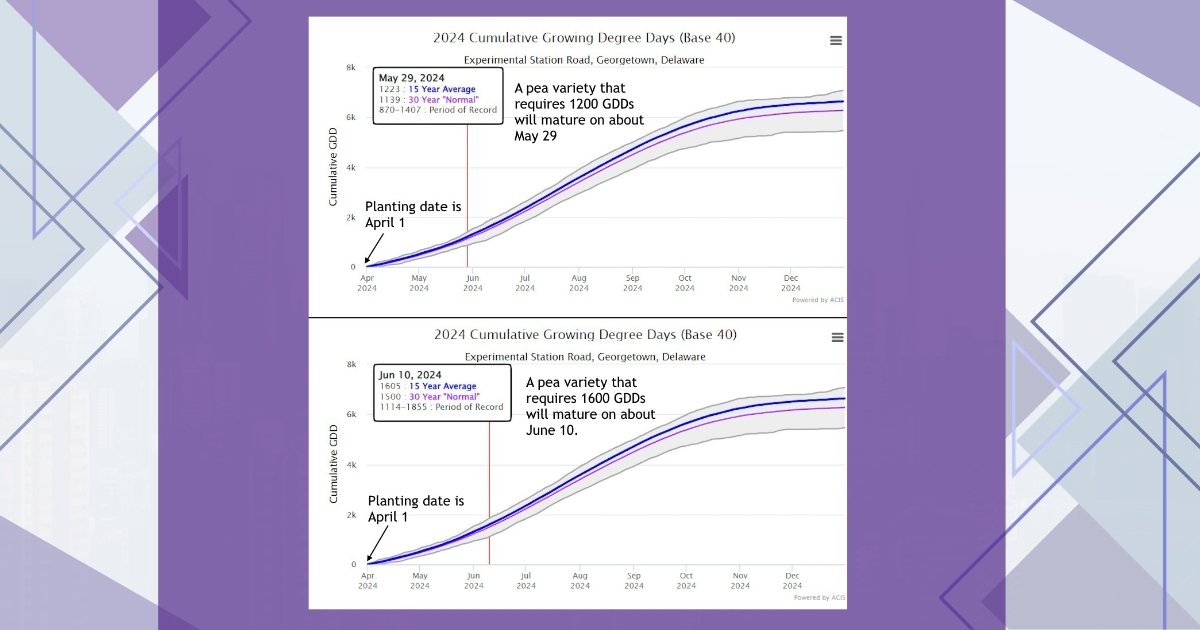
Figure 4. Harvest date prediction for peas using the Climate Smart Farming GDD Calculator.
NEWA System
Farmers may want to use weather data to predict the optimal time to protect their crops from pests and diseases. Weather data from the DEOS network is also accessible through the NEWA system (https://newa.cornell.edu/) thanks to funding obtained by the Fruit and Vegetable Growers Association of Delaware. The NEWA website offers weather summary tools and crop disease and insect pest forecasting models. Many of the available IPM models are for fruit crops, including apple, blueberry, strawberry (Figure 5) and grape. However, there are also models for alfalfa weevil, western bean cutworm, white mold (in soybean and snap bean), seedcorn maggot and some vegetable diseases. If you want to start using NEWA, there are short tutorial videos for each of the IPM models and weather tools. These videos can be accessed by clicking the “Watch Tutorial” button in the top left corner of the page for each tool. Many of the tools include the weather forecast for your location in the model. This can help you know if a pest or disease control application might be needed soon, based on the predicted weather.
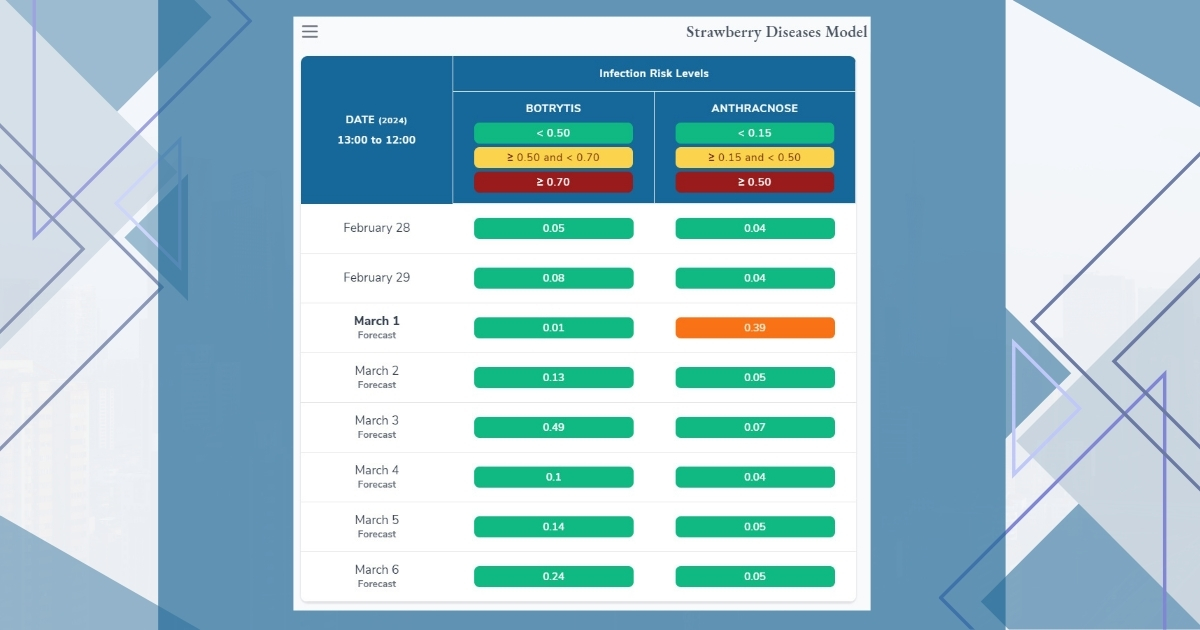
Figure 5. NEWA’s Strawberry Diseases Model includes the forecasted weather for the next 5 days.
Chilling Hours
Because we have had some warmer winter temperatures over the last few years, people have asked about chilling hours. The perennial fruit crops that we grow in Delaware (such as apples, grapes, blueberries and strawberries) require a certain amount of cold weather during the winter in order to come out of dormancy, grow normally and produce fruit.
The chilling hour calculation attempts to model the amount of time when the weather conditions go towards meeting the chilling requirement for the crop. There are Chilling Hours Maps available from the Midwest Regional Climate Center https://mrcc.purdue.edu/VIP/indexChillHours. Different varieties have different chilling requirements, and it is important to choose the right fruit varieties for our climate. After a variety’s chilling requirement is met, it will break dormancy, making it susceptible to freeze damage in a false spring. Planting varieties with a chilling requirement that is too low for our climate puts plants at risk of freeze damage. Varieties with a chilling requirement that is too high for our climate may not leaf out or fruit normally following a warm winter. In the map below, note that locations in Delaware have at least 1,000 accumulated chilling hours as of March 6, 2024. This is sufficient for high-chill blueberry varieties; however, areas that are slightly south of the Delmarva Peninsula may not have received sufficient chilling for the Northern Highbush blueberry varieties with high chill requirements.
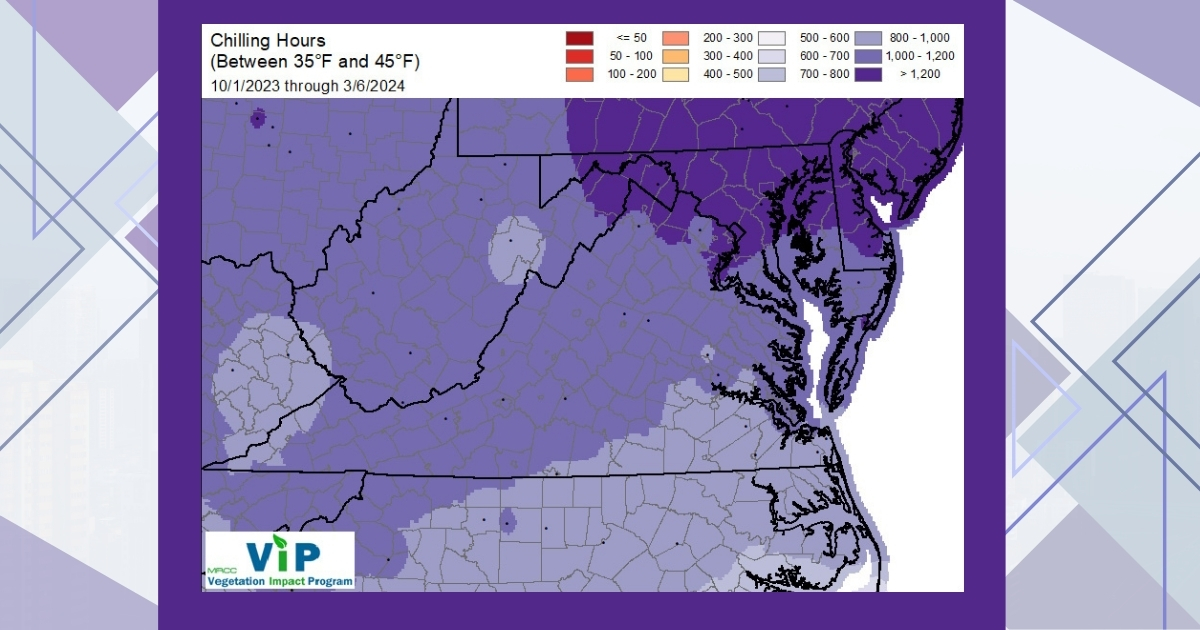
Figure 6. Accumulated chilling hours as of March 6, 2024 for Delaware and the region from the Midwest Regional Climate Center.
As you plan for the 2024 growing season and beyond, you may want to explore some of these weather-based tools that are available to help you make management decisions.
