
History maps win competition
Photos courtesy of Jessie Eastburn and Bridgette Kegelman November 16, 2020
Students’ success with data mapping to be honored at Geographic Information Systems Day
Two seniors in the College of Earth, Ocean and Environment have won a University of Delaware mapping competition recognizing both the art and science of mapping, and the winners combined accurate representation of their data with visual styles reflecting their subject matter.
Both maps will be featured at the University’s annual Geographic Information Systems Day, occurring Wednesday, Nov. 18, along with speakers, networking and a humanitarian mapathon. More details and registration at the GIS Day website.
The UD Student Competition for Geospatial Data Visualization / Map Design was created this year by Jing Gao, assistant professor of geospatial data science in the Department of Geography and Spatial Sciences and the Data Science Institute, both of which sponsored the competition. Gao got the idea for the contest as she was teaching “Cartography: Art & Science of Mapping Data” in the spring, the first time a specific geospatial data visualization course had been offered at the University.
“When the students started developing their respective final projects, we were deep in the pandemic, and students had been fatigued by many challenges (technical and emotional). I wanted to create some structure that was motivational, uplifting, and fun for them, and a university-wide geospatial data visualization competition came to mind,” Gao said. "The judges were extremely impressed by the quality of the entire pool. The competition is an extracurricular component of our geospatial data science education efforts, and we are proud to showcase our students' excellence."
Jessie Eastburn and Bridgette Kegelman won the inaugural competition with two very different maps that nonetheless shared some key similarities. Students from a dozen different majors, each with varying levels of experience with mapping, entered the contest.
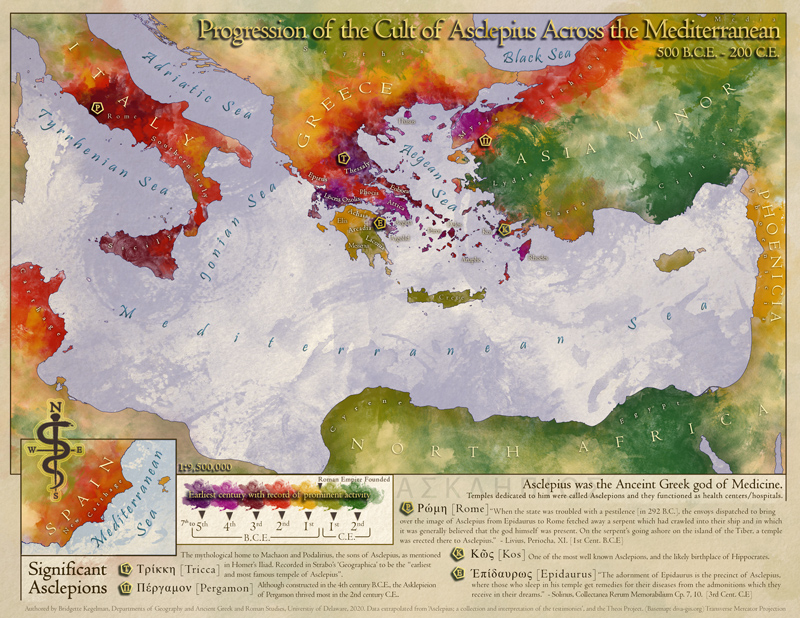
Eastburn created a playful map showing the amusement park that was in Brandywine Springs park at the turn of the 20th century, close to where she grew up in Wilmington. Kegelman designed a map of the Mediterranean showing the spread of the ancient Greek cult of Asclepius over seven centuries. But both thought maps were the perfect medium to share history that had captivated them, and both used sound data to locate what they illustrated.
Brandywine Springs
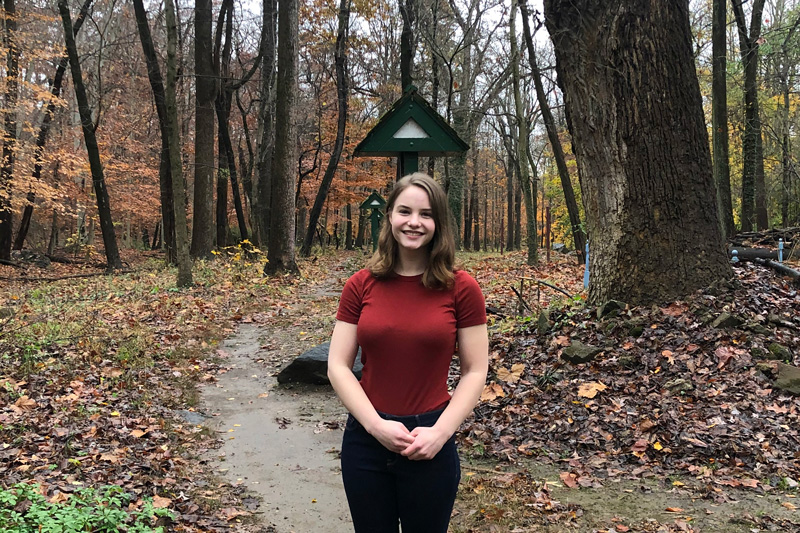
“I grew up going to the park multiple times per week, learning about its history,” said Eastburn, a geological sciences major. “Looking at it you would never expect something like a massively popular amusement park. It’s a really cool slice of history that barely anyone knows about.”
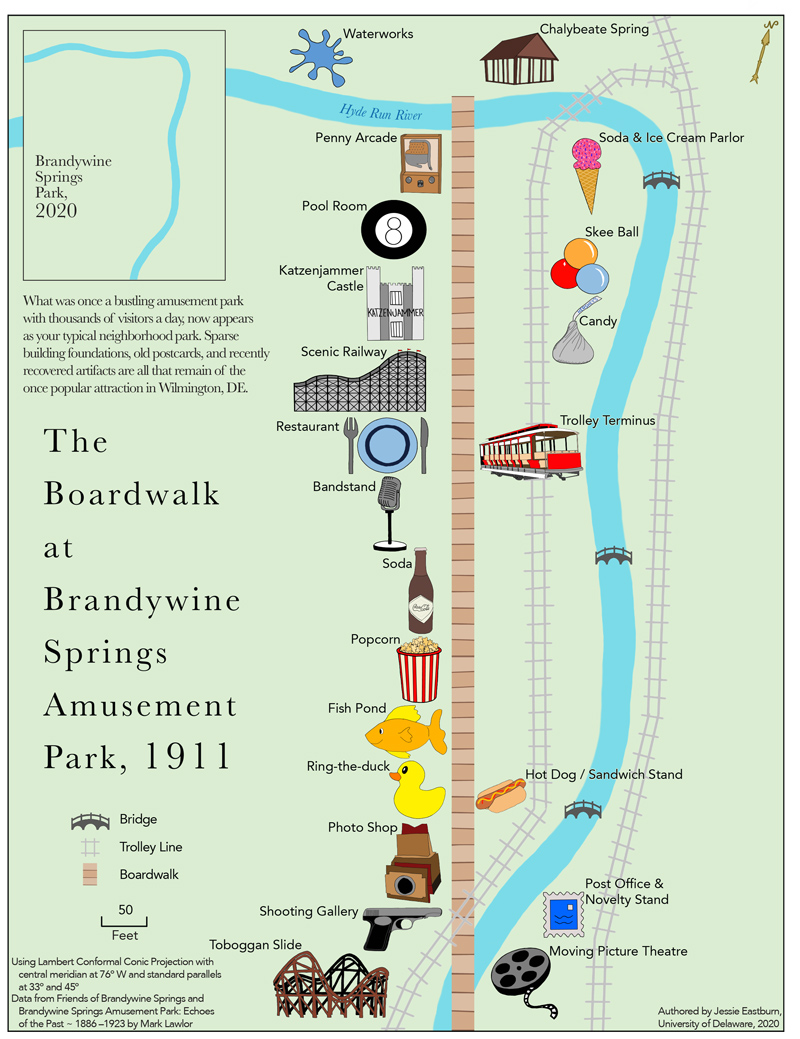
Brandywine Springs Park now has picnic pavilions, a playground, and some hiking trails, but if you know where to look, you can also find the foundations of old buildings and imagine a very different scene. Eastburn said she wanted to create a map that would help people picture the park as it was in 1911, the peak year for the amusement park when it offered the most attractions and drew the biggest crowd (with a record 50,000 visitors in one day).
Eastburn gathered data for the map using satellite imaging and other skills she has learned in courses in geographic information science (GIS) that she has taken to earn both a minor in geography and the graduate GIS Certificate, which Eastburn will complete at the same time as her undergraduate studies.
“The GIS classes I’ve taken at UD have been my favorite by far. It’s definitely a combination of subject matter and just all-around great teachers,” Eastburn said. “They definitely went the extra mile, always trying to find ways to get everyone involved, to get people more passionate about mapping. They’re really involved with the success of their students.”
The Cult of Asclepius
First things first, Kegelman notes in the text she submitted with the map that “in this time period, the word cult had different connotations and referred to something we may consider more like a religious sect today.” In many ways she mapped the spread of medicine, as the followers of Asclepius acted as doctors and used their temples as hospitals.
Kegelman’s map brings together not only two interests of hers, but her two majors: geography and ancient Greek and Roman studies. While her professional aspirations center around mapmaking, especially the artistic aspect of illustrating data and helping people understand its meaning, Kegelman discovered a passion for ancient Greek during a required language class and just kept studying.
“I really like making things,” Kegelman said. “I’ve found cartography to be a combination of art and history and science, which are all things I care deeply about.”

The map that made her one of the winners of the competition combined all three, and Kegelman notes it could be useful for teaching this particular aspect of ancient Greek history. In gathering the information to create the map, she noticed a need that people with her training and interests could fill.
“I thought [the spread of the Cult of Asclepius] would be a really ideal data set to make into a map,” Kegelman said. “There is a lot more data we have on history than there are maps of history.”
About GIS Day
The University has held a GIS Day annually since 2015, and over the past five years, it has added new programming and found additional ways to engage participants. The past few events have featured a humanitarian mapathon, which will focus on providing better mapping in Guyana to assist with COVID-19 response this year. (The mapping is done with open source software and anyone can participate.)
“This year, we are offering something new that we believe will benefit our students: a career panel,” said Olena Smith, lead geospatial information consultant in IT Research CyberInfrastructure and one of the principal organizers of GIS Day. “We will have four GIS professionals from different industries, two of whom are UD graduates. We'll have two student moderators leading the panel.”
In addition to the career panel, attendees of GIS Day will hear from GIS practitioners, students and educators in local government, secondary and post-secondary education and industry, as well as have some time for networking opportunities. More details and registration at the GIS Day website. While GIS Day is open to all, organizers ask that people register with their institutional email address, whether udel.edu or other organizations.
“GIS has rapidly evolved over the years and became an essential technology for applying geography and spatial thinking to decision-making,” Smith said. “My favorite part of GIS Day is our ability to show how versatile GIS is, how it helps in so many areas of our lives, and to bring people together to talk GIS.”
Contact Us
Have a UDaily story idea?
Contact us at ocm@udel.edu
Members of the press
Contact us at mediarelations@udel.edu or visit the Media Relations website