



Category: Mathematical Sciences
Predicting Outcomes with Machine Learning
June 29, 2026 Written by Pak-Wing Fok | Photo by Kathy F. Atkinson
UD math professor explains how machine learning could impact coaching decisions
The World Cup has started! With an unprecedented 48 nations participating (an increase of 16 from 4 years ago), this will be one of the most-watched tournaments in the game’s history. Everyone has their opinions on who will win. Legendary England striker and soccer commentator Alan Shearer thinks that France will be the champions, provided there is no in-house fighting. U.S. soccer hero Landon Donovan thinks Ecuador, Norway and Colombia could be dark horses for the tournament.
Every fan has a favored team, even if the odds of winning are slim, but how do statisticians and data scientists think about match prediction? Data analytics is not new to sports. Baseball has used quantitative analytics for many years, and in the early 2000s, Oakland Athletics famously utilized “sabermetrics” to make decisions about which players to buy and sell. The success of using data to inform sports strategy motivated Michael Lewis to write his 2003 book Moneyball: the Art of Winning an Unfair Game, which was later turned into a movie starring Brad Pitt.
Algorithms vs features
Machine learning (ML) is a branch of artificial intelligence where computers learn patterns and make predictions. It has been around since the mid-2010s, but using ML to predict results is relatively new to sports, and there are many different approaches. Standard ML algorithms include logistic regression, K-nearest neighbors, support vector machine and naive Bayes, but what all these methods have in common is the need for training data. Before producing results, ML needs to know how teams have performed in the past. What were the match conditions? How experienced were the teams?
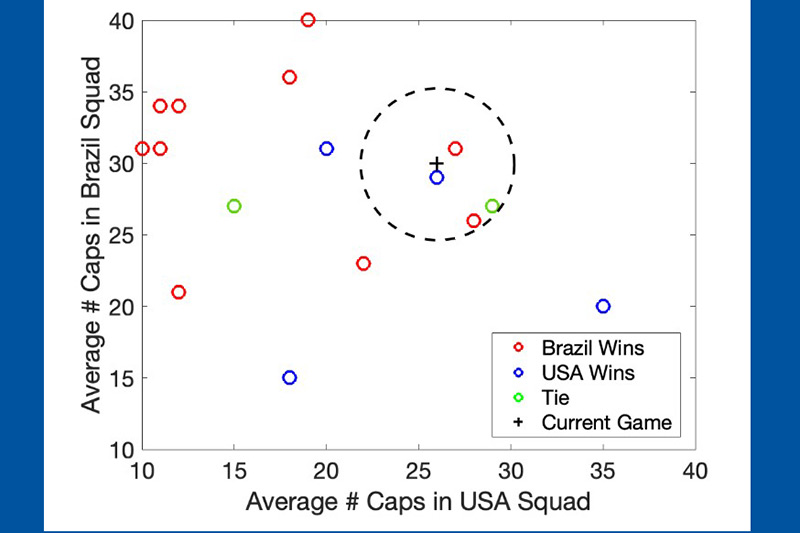
For example, a ML can predict the outcome of a theoretical match between the USA and Brazil using a K-nearest neighbors (KNN) algorithm: see Figure 1. The average number of caps (international appearances) in a squad is an indicator of the experience of the team, and that metric can be used to try and determine the outcome of a game when the USA squad has 26 caps on average and Brazil has 30, indicated by the black cross.
When K=4, KNN takes the four neighbors closest to the black cross and determines the category (USA win, Brazil win, or tie) that has the most occurrences. Two of the games were won by Brazil, one was won by the USA, and one was drawn. Therefore, the algorithm predicts a win for Brazil. The algorithm generally requires the data to be numerical in order for the notion of distance to exist (“nearest” is meaningless without distance). But importantly, there is no restriction on the number of features in the data set. In this example, KNN is applied in 2 dimensions, but other conditions could be included such as humidity, temperature, average wind speed on the match day, the average age of each team, or the number of rest days before the match as extra dimensions. Currently, humans decide which features to include in the data set; practitioners (and probably most soccer fans) believe that choosing the right features is more important than which algorithm to use.
ML could be helpful to team owners in making decisions and to sports fans in predicting winners, but coaches using ML will face the same problems encountered by scientists and engineers. This issue is not necessarily the predictions themselves, but exactly how they get made.
Users rarely know the process by which ML models come to their conclusions. If one team is predicted to beat another, is it because of the weather conditions? The presence of certain players? The home advantage? Coaches need to understand the process by which these back boxes come up with their predictions so that they can plan accordingly and/or adjust their lineup.
ML accuracy
In a recent paper published by Decision Analytics Journal, weather, fatigue and win momentum were all included into a ML model. Intuitively humans understand that these are important factors in deciding a match outcome. The issue is to quantify these factors before training an ML model on them. For example, you could define a fatigue factor as 1/(time between previous and current game). You could define win momentum as the number of wins in the last three games. But these definitions are not universally agreed upon and different definitions will almost certainly affect the predictions.
In general, the accuracy (number correct predictions divided by the total number predictions) of ML models is about 60% with slight variations among the different algorithms. The algorithm studied by Wong et al. is only a few percentage points less accurate than that of large professional bookmakers such as William Hill and Pinnacle. So at the moment, the bookies have an edge over machines, at least for now. Things may be very different for the 2030 World Cup!
Pak-Wing Fok is a professor in the Department of Mathematical Sciences in the College of Arts and Sciences. He ran the Society for Industrial and Applied Mathematics Graduate Student Mathematical Modeling Camp for graduate and advanced undergraduate students to strengthen their technical abilities and scientific communication skills. “A predictive analytics framework for forecasting soccer match outcomes using machine learning models” by Wong, Li, Huan Le, …appeared in Volume 14 of Decision Analytics Journal (2025).


