


Banking on data
New tools help scientists gather environmental information
RESEARCH | At any given moment, UD researchers are monitoring a profusion of regional environmental phenomena—weather changes, stream flow, tidal conditions, coastal flooding, salinity levels, and on and on.
Helped by a strong and growing suite of technological tools, they’re harnessing the data to answer a wide array of critical questions, such as how to best monitor coastal storms; how to track harmful algal blooms, which can deprive waters of oxygen; and how changes in ocean circulation might be related to climate change.
But it doesn’t stop there.
Scientists in the College of Earth, Ocean, and Environment (CEOE), who collect many of these data sets for individual research projects, have formed the new Center for Environmental Observations with the goal of merging this vast amount of information so it’s more available for end users. The college’s center will be aligned with a statewide organization called the Delaware Environmental Monitoring and Analysis Center focused on this same purpose.
“All of these disparate data sets individually are good, but together they’re really good,” says Dan Leathers, CEOE deputy dean and professor of geography. “It makes the University special in that we have all this in one college and we’re able to integrate it into something that can hopefully help to solve some difficult issues.”
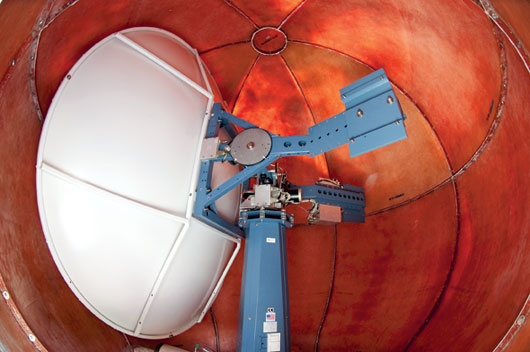
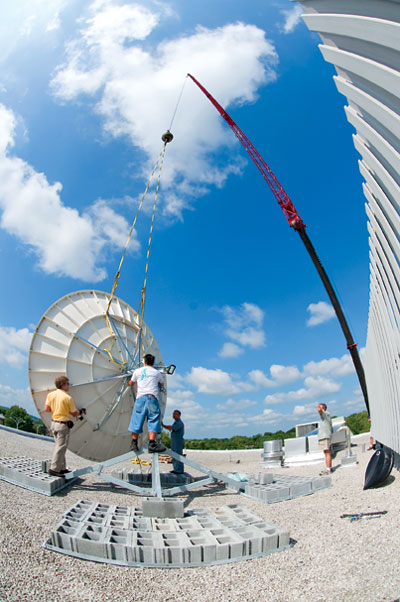
So what kind of data are these? The newest additions come from two satellite receiving stations installed in July. From their perch atop Willard Hall Education Building—chosen because it allows a 360-degree view of the horizon with no electromagnetic interference—the receivers collect real-time information sent to Earth from satellites passing overhead.
Two of only a handful of receiving stations on the East Coast, they capture data from the middle of the Atlantic to the center of North America and from Cuba to Newfoundland. One of the receivers provides information on land and ocean surface conditions such as sea-surface temperature, chlorophyll concentration and currents, while the other focuses on atmospheric and weather changes such as tropical storm activity and temperatures.
A pair of longstanding UD monitoring agencies providing additional information are the Delaware Environmental Observing System (DEOS) and the Delaware Geological Survey (DGS). DEOS maintains 45 automated weather stations around the state and also collects land and water data from other networks. It provides data on weather conditions, tides, snow depth and many other environmental variables. DGS, a state agency housed in CEOE, focuses on geologic and hydrologic research and supplies information on everything from stream flow to coastal flooding.
Adding to the mix is a variety of instruments being used and honed for other research projects. These include buoys that collect water-quality data as well as high-frequency radar that’s used to monitor currents and various other aspects of the coast. There’s also a team of underwater robots, torpedo-shaped devices that use sonar sensors and other instruments to gather acoustic “pictures” and water-quality data such as salinity and temperature when launched.
Assimilating all of these distinct data sets won’t be easy, researchers say, but the idea has already taken off with the development of three visualization labs by the college.
Installed over the past year on both the Newark and Lewes campuses, the labs have transformed the way researchers interact with data. They use Google Earth, the 3-D visualization system Fledermaus and other computer visualization systems to display real-time data streams on everything from global ocean temperature to currents—all at once and on large, interactive flat screens.
“Until now, our vision of the marine environment has largely been fragmented and incomplete,” says Art Trembanis, assistant professor of geological sciences. “With the visualization capabilities, we can put together a better picture of it.”
Trembanis’ lab accompanies those established by Matt Oliver, assistant professor of oceanography, and Xiao-Hai Yan, Mary A.S. Lighthipe Chair and director of UD’s Center for Remote Sensing. Complementing those labs is a geographic information system (GIS) computing center created this fall in the Department of Geography that provides a close look at spatial data.
Next up, CEOE plans to fill a new staff position supported by a grant from the National Science Foundation’s Experimental Program to Stimulate Competitive Research. That person will be responsible for integrating the data from various sources, storing and archiving it in a database and making it available to those who can use it.
Those users are already lining up. In addition to UD scientists and students, they include other university and government researchers as well as state government emergency response and monitoring agencies. Educators at the K-12 level are also expected to make use of the information.
As Trembanis puts it, such an extensive, “soup to nuts” offering on environmental data is a benefit for all involved.
“Now with the receiving stations, DEOS, the other data sets and the visualization, we are active producers, we are active consumers, and we are active distributers,” he says. “It can’t but be good for our students and our science.”
Article by Elizabeth Boyle