


Technology offers a wide world view
RESEARCH | A project in the College of Earth, Ocean, and Environment is giving scientists a new perspective of the world.
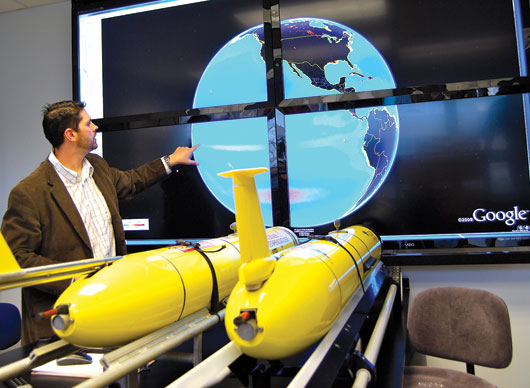
The Global Visualization Lab uses Google Earth to view real-time data streams of everything from ocean temperature and currents to the movement of ships in Delaware Bay—all at once. The data come from numerous sources including satellites, autonomous underwater vehicles and floating buoys and are pulled into Google Earth via KML files, special file types that display geographic data.
When viewed on the lab’s four 55-inch flat-panel TVs and navigated with a 3-D mouse, the Google Earth globe and any data illustrated on it are seen with such high resolution and detail that viewing the image can feel more like a high-flying helicopter ride. The technology represents a new way for oceanographers to see a wide variety of real-time data all in one spot and in a standardized format that anyone with Google Earth and the right KML files can use.
The lab’s creator, Matt Oliver, assistant professor of oceanography, says the technology provides a completely new sense of the ocean.
“Oftentimes you’re out on a boat, and you wonder what it is that you’re missing. When you’re out there you feel so small,” Oliver says. “This technology really allows you to see the large scales of the ocean unfold in front of you.”
Oliver is part of a cooperative effort among multiple universities and institutions working on the visualization project.
Leveraging several organizations’ resources has helped illustrate another strength of the lab, Oliver says: It allows the data-gathering technologies not just to work parallel to each other but also, for the first time, to work together. That has positive implications for how data is collected and viewed, he says.
In their first test of the system, Oliver and his collaborators used satellites, underwater vehicles and other devices to study winter algal blooms in the mid-Atlantic over a two-week period in November. As the data came in, computer models automatically analyzed it, created forecasts and reported directly to the autonomous underwater vehicles to tell them where to sample next.
Other applications for the technology are expected to be far-reaching. For example, scientists could use it to study the health of coral reefs, the amount of chlorophyll in the ocean or the movement of electronically tagged wildlife. Oliver is using it for a NASA project studying how climate change has affected habitats on the West Antarctic Peninsula.
Adding another level of sophistication to the project, the College of Earth, Ocean, and Environment is purchasing two real-time satellite-receiving stations. The stations will let researchers download data from passing satellites that have captured geographic information from Newfoundland to Cuba as seen from space.
With the additions, UD will become one of only a few institutions on the East Coast with receiving stations, according to Oliver. “They are going to make Delaware one of the most looked-at places on the planet,” he says.
Article by Elizabeth Boyle