


Community flood maps
Delaware Sea Grant, partners develop interactive flood risk visualization tool


8:47 a.m., Dec. 3, 2014--While Nov. 30 marked the official end of hurricane season, winter and spring months also can generate large weather events — including nor’easters that can bring significant flooding to the Delaware coast.
Historically, winds, waves and storm tides associated with nor’easters have resulted in considerable damage in the form of beach erosion and flooding of low-lying coastal areas.
Campus Stories


From graduates, faculty
Doctoral hooding
The Delaware Sea Grant College program recently unveiled interactive flood risk awareness maps for 10 communities in Sussex County, many of which have experienced significant bayside flooding in recent years, especially during Hurricane Sandy.
The project is a collaborative effort between Delaware Sea Grant, the U.S. Geological Survey (USGS), and the Delaware Department of Natural Resources and Environmental Control (DNREC). It is supported through funding from the National Sea Grant Coastal Community Climate Adaptation Initiative.
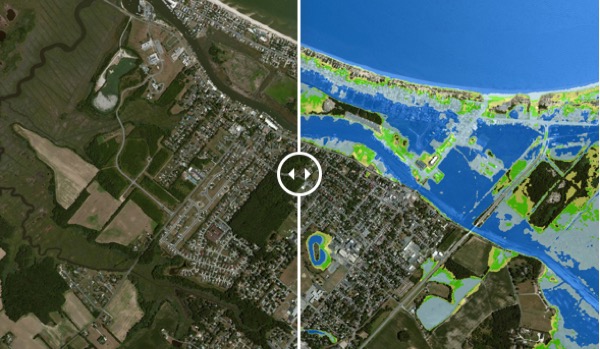
The interactive map tool depicts the landward extent of flooding (how far floodwaters would travel in a horizontal direction) — and how deep the water could become — in the event of a one percent annual chance (or 100-year) flood. In areas with the greatest risk of flooding, known as Special Flood Hazard Areas, a building has a 26 percent chance of being flooded over the course of a 30-year mortgage.
A slider lets viewers click and drag a flood-depth map over the area expected to flood during a 100-year flood as designated by Federal Emergency Management Agency (FEMA) Flood Insurance Rate Maps. Where high water data is available, the maps depict actual flooding levels for designated storms including Hurricane Sandy and a 1998 nor’easter.
“The maps can help residents, property owners and community decision-makers visualize the potential depth and extent of flood impacts, providing an improved understanding of damage possible from a significant flood or storm in their area,” said Wendy Carey, a coastal hazards and resiliency specialist with Delaware Sea Grant, which is housed in UD’s College of Earth, Ocean, and Environment.
“It’s important to know whether a flood event is expected to bring 2 inches or 2 feet of water to a specific property or neighborhood, and how that might affect evacuation routes.”
Community flood risk awareness maps are available for Bethany Beach, Broadkill Beach, Dewey Beach, Fenwick Island, Lewes, Long Neck, Milford, Oak Orchard, Pot Nets and South Bethany. They were developed with USGS mapping expertise and DNREC elevation data, in combination with the latest FEMA flood mapping products and high water elevations associated with historic storm events.
Community resiliency and climate adaptation are major priorities for the national and Delaware Sea Grant programs. Improved elevation data and hydrology and hydrologic models have resulted in better flood maps in recent years.
“My goal is to ensure that these new maps also result in an increased awareness of hazards and vulnerabilities. These flood risk awareness maps are an additional tool that can be used to communicate flood risk to individuals, while communities can apply the mapping tool to land use decision-making and consideration of higher regulatory standards,” explained Carey.
FEMA flood maps are based on historic flood information for a given area and show two-dimensional, horizontal flooding based on hydrologic models and coastal flood study models. They figure into building permits, environmental regulations and flood insurance, among other things, but do not incorporate future flood risk.
According to Carey, an increasing percentage of Delaware’s coastal population will be threatened by future flooding related to rising sea levels and coastal storms including tropical systems and nor’easters. In fact, the highest recorded tides along the Delaware coast — aside from those brought about by Hurricane Sandy — were recorded during nor’easters in 1962, 1992 and 1998.
Carey said she hopes the new tool will complement other available decision-making resources and encourage residents to heed announcements from local emergency managers during storms. She advocates that residents:
- Understand their flood risk and know whether they live in or near a flood plain;
- Prepare in advance by gathering emergency supplies and an evacuation kit, developing an evacuation plan, and understanding how flooding can affect evacuation routes;
- Check insurance policies. Flood insurance is needed to obtain coverage from flood events and standard homeowners’ insurance policies do not provide protection against floods; and
- Follow all instructions issued by emergency management officials.
For more information on how to prepare for this and other natural hazards, visit the website or view the Delaware Homeowners Handbook, produced by Delaware Sea Grant, Delaware Department of Natural Resources and Delaware Emergency Management Agency.
Article by Karen B. Roberts