John P. McLaughlin
The thesis of this chapter is that the capabilities and limitations of the visual system produce certain perceptual effects that have been exploited by painters to make their work more pleasing or more interesting. The chapter will describe a few characteristics of light, some of the basic features of the anatomy and physiology of the visual system and show how works by five painters in particular have capitalized on those features.Specifically we will examine Arcturus II by Victor Vasarely; Flag Above White by Jasper Johns; Sunday Afternoon, La Grande Jatte by Georges Seurat ; Exact Quantities by Richard Anuszkiewicz and Current by Bridget Riley.
LIGHT AND OPTICS
A great deal of the energy in the world is electromagnetic radiation. This energy can be described physically in a couple of ways. For our purposes, consider the energy to be a series of waves, like ripples on a pond. As such, the waves will have peaks and valleys that follow each other at some frequency. Two physical measures can be immediately defined. The amplitude of a wave is the vertical distance between the top of the peak and the bottom of the valley. It is a measure of the intensity of the energy. Generally, the psychological responses to changes in intensity are changes in brightness. The second characteristic is the wavelength which is the horizontal distance between corresponding positions, e.g., peaks, of two consecutive waves. As wavelength varies, electromagnetic energy's effects on the human body vary, from none to severe damage. For example, FM waves are about one meter long. You are constantly surrounded by such radiation in a society like ours, but your body remains blissfully unaware until you get a radio. At the other end of the spectrum, gamma radiation, with a wavelength of 10 to the -12 meters has deadly effects on us. In between, energy with wavelengths measured in nanometers (1 nanometer = 1 billionth of a meter) is visible to us because it affects chemicals in our eyes in a generally benign way. This portion of the electromagnetic spectrum, 400 - 700 nanometers, is typically called the visible spectrum, or, more simply, light. Variations in wavelength are described as variations in hue by observers. As wavelength increases from 400 to 700 nm, the hues reported gradually change from violet to blue to green to yellow to red. To pursue the "wave" metaphor a little further, it is highly unlikely that you will encounter light that is pure, i.e., containing only one wavelength. In virtually all circumstances, the light we see is a mixture of many wavelengths, so that the wave is more akin to those we behold at the ocean, varying in shape from one to the next.
THE RETINA
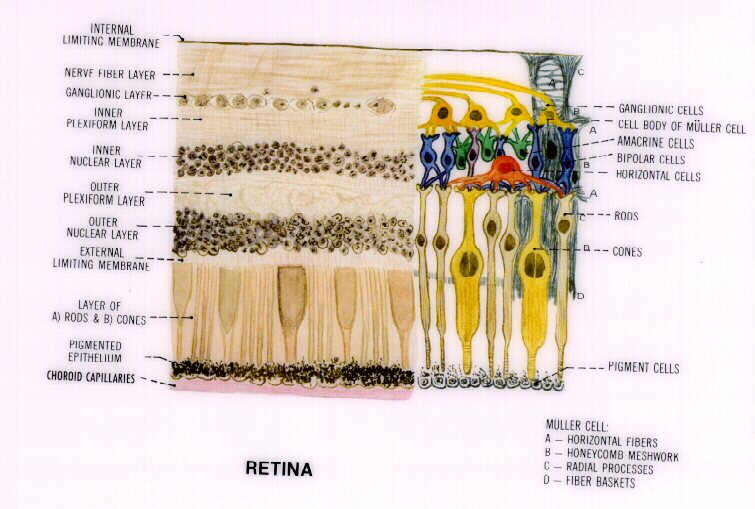
Since most of the light we see has been reflected from objects in the world, patterns of the reflections provide information about the edges, shapes, movements and colors of that world. When light reaches the eye, the extraction of that information begins immediately. Light passes through the transparent structures in the front of the eye, notably the cornea and the lens, and is focussed on the retina, which covers the inside of the back half of the eye, and contains the light-sensitive chemicals that do the initial extraction. One type of retinal cell, called a cone because of its shape, can contain any one of the three chemicals that are affected by normal levels of light. These chemicals differ from each other in the portion of the visible spectrum to which they respond. Remember that the visible spectrum contains energies that vary in wavelength from 400 to 700 nanometers. One chemical absorbs energy from the energies with the shortest wavelengths, 400 to about 500 nanometers, a second absorbs energies from the middle of the range and the third from the upper end of the range. Since one chemical will respond to a given stimulus and another may not, information about wavelength is immediately extracted. The pattern of bright and dark areas across the array of light will also determine how much energy these cone cells absorb.
When a cone cell absorbs energy, it emits nerve impulses which excite other nerve cells in the next layer of the retina (see diagram). When a nerve impulse reaches the terminal fibers of the cone cell, those parts of the cell release a chemical into the surrounding space, which is called a synapse. That chemical excites the membrane of a second cell, a bipolar cell, thus initiating a nerve impulse in the bipolar. That is the simplest anatomical pattern, but it is also possible that portions of other bipolar cells may inhabit the same space and, if so, the released chemical will affect them too. The synapse may also be populated by portions of horizontal cells, which are stimulated by the chemical and which will carry information laterally to other synapses and other bipolar cells.
When the bipolar cells synapse with cells of the next layer, the ganglion cells, the lateral motif is also repeated. Here amacrine cells inhabit the same synapses as the bipolar and ganglion cells and relay information laterally to other such synapses. So, once again, information can flow vertically, from bipolar to ganglion and horizontally via the amacrines from ganglion to ganglion.
THE PERCEPTION OF EDGES
For our present purposes, assume that the horizontal flow is generally inhibitory and the vertical excitatory. Suppose that the image of a bright, but somewhat blurred line falls on the retina. Cones directly under the brightest part of the line should stimulate their bipolar and ganglion cells (Group A), causing an increase in their firing rates. Cones under the blurry edges of the line should excite their corresponding cells too (Group B), but to a lesser extent because the intensity of the blur is not as high as that of the line's center. The Group B bipolar and ganglion cells will fire even less, however, because they will be inhibited by the information coming via the horizontal and amacrine cells from Group A. This is called lateral inhibition and in this way, the system reduces the blurriness of the optical image, but at the neural level.
A good deal of the visual system is devoted to the perception of edges, or lines. It turns out that any image of a line that falls on the retina will be blurred to some extent. The combination of vertical and horizontal flow of information in the retina, as described above, aids in the elimination of that blur. This is a single example of a general perceptual phenomenon called simultaneous brightness contrast that is produced by lateral inhibition. The brightness or darkness of a surface will make neighboring surfaces look darker or brighter than they otherwise would. The general principle is that differences in appearance between neighbors are magnified. So, a dark area makes an immediate neighbor look brighter and vice versa, thus reducing or eliminating the blurriness of a line.
Another specific example of this effect was described by Ernst Mach in 1865 (Mach, 1959). He pointed out that an edge between a white area and a black one is so enhanced that the black side of the edge appears actually blacker than the rest of the black area. Similarly, the white side of the edge appears whiter than the rest of the white area. There appear to be, in other words, bands of extra blackness and whiteness at the edge. The bands are called Mach bands and are another product of lateral inhibition.
Artists have portrayed these bands in their works, before and since Mach's published description (Latto, 1995). If you examine Seurat's Sunday Afternoon, La Grande Jatte, you can see an example. The profile of the major male figure in the right foreground, particularly at the lips and chin, contains an extra- dark line and the immediate background contains and extra-light one. Seurat, apparently, did not trust the visual system to do its work in this case, although he did in the matter of color perception, as we shall see.
Contrast effects can be used by artists to enhance the brightness of areas to create illusory images. Consider the painting in Figure X, Arcturus II by Victor Vasarely. The painting is subdivided into differently-colored quarters, with each quarter consisting of a series of concentric squares each a little smaller than the next and each a little lighter than the next, with the exception of the red quarter. The blue, green and violet quarters are arranged so that the smallest, lightest square is in the center of the pattern, surrounded by the next larger and next darker one, which is in turn surrounded by the next larger and next darker, and so on, until the largest, darkest square is reached. Notice that the diagonals of these squares seem to glow. Where does the glow come from ? Each band is uniform in color and lightness, yet they do not appear that way. They appear to be lighter at the corners, producing the glowing diagonals. On the other hand, the medium-sized squares of the red quarter do not vary in lightness very much at all and the diagonals do not glow.
The glow is the product of simultaneous brightness contrast, which depends on lateral inhibition. The accompanying sketch shows some areas of one set of the squares along one diagonal. The numbered areas are arbitrary divisions of the squares and are simply identified for this exposition. Consider area 7. It is surrounded on two sides by areas 1 and 3, which are darker than 7. If contrast effects are at work, area 7 should be rendered brighter than it normally would be by the neighbors 1 and 3. Now consider area 6. It is bounded by only one darker area, area 4, so it should not be subject to as much brightening as area 7. The same relations hold for the next interior band. Area 9 is bounded by darker areas 6 and 8, while area 10 is only bounded by one darker area, 5. Therefore, area 9 should appear brighter than area 10. These relationships hold all along each diagonal and are the reason for the apparent glow. The absence of lightness differences in the red quarter prevents the illusion's appearance there.
__________
| 2 3 4
__________
| 1 | 7 6 5
__________
| 8 | 9 10
________
| 11
Fig.X.1 A schematic drawing of a subset of bands from Vasarely's Arcturus II.
The perception of lines is not solely based on retinal mechanisms, but it certainly begins with and depends on retinal characteristics. Cone cells are not distributed evenly across the retina. In the center of the retina there is an area, called the fovea, which is densely packed with cones and has no other kind of light-sensitive cells. However, the number of cones drops with distance from the fovea, so that there are almost none at the periphery of the retina. The fovea is that part of the retina that receives the image of that portion of the world at which we look directly and it is the retinal area that is able to detect the thinnest lines. The periphery, by comparison, has much poorer acuity.
The interaction of excitatory and inhibitory influences described above makes it important to understand that the retinal cells are always active, i.e., there is a baseline level of activity that is characteristic of a cell. Any given cell, let us say a ganglion cell, can receive information that will excite it, i.e., increase its activity. That same cell will also receive information that will inhibit it, i.e., reduce its activity, resulting in a net increase or net decrease in activity, above or below the cell's baseline level. Net increases or decreases can signal different things to higher levels of the system.
The excitatory and inhibitory influences create a geographic organization in the retina and in the brain that produces many perceptual effects. Consider this experiment. Record electrical activity from a retinal ganglion cell while you move a pinpoint of light across the surface of the retina. At some place in its excursion, the light will excite the cone cells that send information to that ganglion cell. The activity in the cell will increase over the resting level. As the light moves on, it will affect other cones and, from their synapses, they will dispatch inhibitory messages to their neighbors, including our target ganglion cell. Its activity level will now drop below resting level. It turns out that the area on the surface of the retina in which the light is effective has a very familiar shape, a doughnut. Stimulation within the center "hole" will have one effect on a ganglion, say an excitatory one, and stimulation anywhere in the surrounding ring will have the opposite effect, in this case inhibitory. The area on the surface of the retina is called the receptive field of that ganglion cell. Every retinal ganglion cell has one, so that the functional geography of the retina is a mass of partially overlapping doughnuts.
The size of the fields can vary. The receptive fields in the fovea are generally small, but they do vary in size. As you move out of the fovea toward the periphery, the fields are larger and larger, but variation in size occurs at any location. What does variation in size do for us? It probably causes assimilation effects that are important in engravings and some paintings. Look at the image of George Washington on a one-dollar bill. The forehead area is a mass of very thin light and dark lines, while the coat area is filled with thicker dark lines and very thin light ones. The forehead looks light and the coat dark because the dark and light lines are being summed by one part of the system to produce different levels of darkness even while other parts of the system discriminate the lines from each other so that we can see them. The sizes of receptive fields contribute to this. A large field will collect all of the light falling on it from many lines and sum it together, but small fields will be more likely to pick up only one line and thus discriminate one level of lightness from another. That the fields are in the same place on the retina, i.e., overlapping, allows us to see the engraver's effect.
Some of the variation in size may be due to the type of retinal ganglion cell. Retinal ganglion cells have been differentiated on the basis of size of the cell bodies, but they differ in other characteristics as well. The large-sized cells, M cells (for Magno), have thicker axons than the smaller cells, P cells (for Parvo), thus indicating that M cells have faster nerve conduction speeds. Furthermore, M cells respond when light of any wavelength enters the eye, suggesting that they code intensity, while P cells respond selectively to particular wavelength bands, suggesting that they are important for coding color. Also these P cells have smaller receptive fields than M cells, suggesting that they respond to smaller, or thinner objects.
Returning to the vertical flow of information, the ganglion cells' axons extend along the retina and converge on a location a few degrees to the noseward side of the fovea. All of these axons form a bundle which passes through the retina and the back wall of the eye at that point. This is the beginning of the optic nerve. It has been a curiosity that has entertained people for centuries that this one spot on the retina is blind. Since all of those axons pack the space, there is no room for light-sensitive cells there. Why we do not see a small hole in our visual field is a question to be taken up later in this book.
The optic nerve is composed of highly organized bundles of fibers coming from each eye. For example, the axons from those ganglion cells on the noseward half of the retina of each eye are kept separate from those from the earward halves. These sub-bundles go to different locations further back in the brain and, within that division, the axons from P cells also go to different locations than do those from the M cells. All of the axons terminate deeper in the brain, in areas called the lateral geniculate nuclei (LGN). Within each LGN, the P-cell axons and the M-cell axons are segregated into separate areas.
The new fibers that begin at the LGN project back to the rear of the brain, called the occipital lobe, and particularly to an area on the brain's surface, or cortex, called visual-area 1 (V1). The cortex is multilayered and very different things go on at these different layers. The basic pattern is that fibers which synapsed with P-cell axons in the LGN project to a different subset of layers than do those fibers that synapsed with M-cell axons. Some layers receive projections from both sets of fibers and some from only one.
Some of the cells in V1, largely those with inputs from the M-cell system, have retinal receptive fields, but they are quite different from the doughnuts of the retinal ganglion cells. Some cortical cells will be excited when the image of a line in a particular orientation, let us say a vertical, falls in a particular retinal area. The same cell will not fire if the line is in a different orientation, say diagonal. In fairly extensive studies of monkeys, it has been demonstrated that there are far more "vertical" and "horizontal" cells than "diagonal" cells in V1 (Sekuler & Blake, 1994). This seems related to findings in humans of poorer visual acuity for diagonal lines than for verticals and horizontals. That pattern of findings has led some scholars to argue that paintings using strong vertical and/or horizontal lines are successful because of this bias in the visual system (Latto, 1995; Solso, 1994). Lest one think that this offers a simple formula for producing art, remember paintings that you like. How many are characterized by vertical or horizontal patterns? Monet's Poplars series of paintings offers an example of the use of vertical lines, but one should remember that Monet also did the Waterlillies paintings which, by and large, possess neither dominant vertical nor horizontal patterns. Both series are quite lovely, however.
Other populations of cortical cells require an even more specific pattern before they will respond. These cells are sensitive to directional movement as well as orientation, so that a particular cell might fire most to a vertical that moves left to right, less so when the vertical moves right to left and not at all when the moving line is a diagonal. A third group of cells in V1 will respond only to even more specific patterns of retinal stimulation. A cell from this group may respond to a line of a particular length and orientation moving in a one direction. Another might respond only to a line forming an acute or an obtuse angle.
Thus, there is an elaborate cellular structure in the visual system that is dedicated to the perception of the edges that define the boundaries of objects in the world. It is probably also responsible for the perception of edges that do not exist in the world. Consider Figure X. We perceive a bright triangle partially occluding three black balls. However, most of the line segments of the triangle are not formed by any drawn line. It is as if the arrangement of the balls leads us to expect that a triangular object is blocking our view of part of each ball, so therefore we see the triangular figure. These illusory edges have been exploited by at least one artist, Ellsworth Kelly, in a series of abstract paintings called La Combe (see fig. X). It has been noted (Shapley, 1996) that the illusory edges in Kelly's highly abstract paintings are not easily explained by the expectancy argument above. What is there to expect in these abstractions? Rather, the edges are probably the result of the operation of the physiological system we have been considering. That conclusion has been reinforced by demonstrations that illusory edges disappear when there are only hue differences, not brightness differences in the pattern (Livingstone and Hubel, 1995). When only hue differences define edges, we can see the pattern of the three balls with missing wedges, but we do not see the triangle and its illusory edges. Something other than cognitive expectation seems to be needed to produce the illusion.
COLOR VISION
As indicated above, the initial information about wavelength is achieved by the differential response of the three chemicals in the cones to any stimulus. P-ganglion cells then respond differentially to inputs of varying wavelength. For example, a particular cell might show an increase in activity when red light enters the eye, but show a reduction when green light enters. In the connections between the LGN and the layers of V1, color information is separated from the information required for the perception of shape, form and motion. Within the color system, the information seems to be organized into two chromatic sub-systems, red-green and yellow-blue. Red and green experiences seem to be the results of opponent activity within one sub- system, as blue and yellow depend on activity in the other. The nature of that opponent activity is found in the rate of neural firing in the system. As you have seen in the earlier discussion of receptive fields, cells can fire at rates above their baseline levels or below. One color, red (or green), is produced by an increase in the activity in the system of neurons above baseline levels and the other color is produced by a reduction in that activity below baseline levels. Supporting evidence for this is found in electrical recordings from LGN cells. In addition, contrast effects offer some behavioral support for this theory. Simultaneous color contrast illustrates the pairing and the opponency, e.g., a red surround makes the surrounded target more green, but leaves its blue- yellow quality unaffected. Parallel effects are found for blue or yellow surrounds.
Contrast effects also occur successively. If you stare at a surface that has some lightness and some hue for 30 seconds or so and then look at a plain white surface, you will see an image of the same shaped surface with an opposite degree of lightness and the opposite hue. Stare at the center of an orange disk that is somewhat dark. Afterward, you will see a bright, aqua disk on that white paper. While this effect has not been frequently exploited by artists, Jasper Johns' Flag Above White is a successful example. In the painting, the top half of the canvas displays a flag in which the stars are black on a yellow field and the stripes are green and black. If you stare at the center of the flag for a while and then look at the bottom half of the canvas, which is simply white, you will see Old Glory in the appropriate colors. These successive effects are the result of patterns of neural activity too. If a neuron's activity is increased by some stimulus for a time, its activity will drop below baseline for a while when the stimulus is removed. If that neuron's increased activity signals "red", the opponent color, green, appears when the activity drops below baseline. There are other features of our perceptual experiences that lead one to the same general theory. For example, if you search your memory you will not remember ever experiencing a color you would call reddish green. Never happens. The same is true for bluish yellow. The members of each pair never occur together in the same time and same place, again suggesting an opponency in the relationship within each pair. What experience is associated with baseline activity ? The reported experience when red and green beams of light are superimposed on a screen in equal amounts is that of white or gray. The same is true for blue and yellow beams. If you combine colors from different opponent pairs, of course, you can create many different combinations. Depending on the intensity of each beam of light, for example, green and blue can be combined to produce an array of shades of aqua. Yellow and red can be combined to produce a wide range of oranges.
Let us consider another outcome of placing different colors next to each other. In this case, assume that each colored area will be tiny. Anyone who has taken a visual acuity test knows that shapes, e.g., letters of the alphabet, can be made so small that they cannot be read. The black lines of, for example, the letter "E" blur, that is, they mix with the white areas of the letter and render it indiscriminable from letters like "G" or "F". When tiny spots of different colors are packed together, they blur too, creating a color which is the mixture of the separate colors. These mixtures are sometimes called optical colors because they are produced by mixing colors in the eye and brain rather than mixing paints on a palette. It is interesting to note that the neural systems which process information about color are not nearly as acute as those that process light and dark (Livingstone, 1988). Remember that hue information is separated from light-dark information in the cortex and it seems that the hue system by itself does not "do" edges very well. This should remind you of the disappearance of illusory edges when only hue differences exist.
The French painter, Georges Seurat, is famous for using optical colors in his work. A close look at Sunday Afternoon, La Grande Jatte reveals how he painstakingly deposited small dabs of paint of various colors to create the overall effects he wanted. For example, the flower on the hat of the major female figure appears reddish violet from a distance, but is actually a melange of red and blue points. Why do this ? Optical colors can be more realistic or more vivid than colors produced by mixing paints.
Another manifestation of these effects is the chromatic equivalent of the engraver's assimilation effect. Richard Anuszkiewicz is a painter who has exploited these effects in many paintings, one of which, Exact Quantities, is shown in Figure X. The color of the underlying red field is affected by the colors of the thin lines that are superimposed on it. Thus yellow lines seem to render one portion of the field more orange and the blue lines move another portion toward violet. It would appear that one portion of the system with small receptive fields is resolving lines so we can see them while another with larger fields is summing the information and changing the overall color.
MOVEMENT EFFECTS
Artists who capitalize on features of the visual system such as those described above attracted a good deal of attention in the 1950s and 60s. The "Op-art" movement included many who created illusory colors and movement in their works by incorporating effects that had been described in the psychological literature earlier.
Richard Anuszkiewicz, Ellsworth Kelly, Jasper Johns and Victor Vasarely were such painters, and another was Bridget Riley. A reproduction of one of her works, Current, is in Figure X. As you look at the narrow black and white stripes, you will very quickly become aware of movement or shimmering in the picture. What produces this ? One guess is that it is produced by tiny automatic eye movements. When we look directly at something, our subjective impression is that a stationary object is just that, stationary. However, to prevent fatigue of the retinal receptors, the eye changes fixation rapidly, putting the image of the object on a series of slightly different retinal spots. We have the experience of stability in most circumstances, because the pattern of light is highly and clearly organized and that fixated object is not confused with anything else.
Just the opposite is true when you look at Current. With so many light and dark lines packed into a small space, there is no obvious visual anchor, no object. Instead, the shifting of the pattern on the retina caused by the tiny movements mimics what you would see if the lines were actually moving or shimmering. So you experience motion.
Looking at Current, you will also gradually become aware of faint colored wavy lines that are vaguely horizontal. Where are these colors coming from ? One guess is that they are produced by those same eye movements across the vertical stripes which creates an imitation of the neural activity normally produced by stimulation of the color system. Since the early 19th century we have known that intermittent dark and white flashes of light can produce color sensations. As we have better understood that temporal sequences of neural activity are a basic code of the nervous system, it has been suggested that those phenomena may be caused by the intermittent stimulation's ability to create neural activity that mimics the activity of the color system. In Riley's work, eye movements may be increased by the lack of meaningful structure in the pattern. If many eye movements occur, the same sort of intermittent stimulation may be produced, leading to the phantom colors.
REFERENCES
Hurvich, L. (1981) Color Vision. Sunderland, Mass: Sinauer Associates.
Latto, R. (1995) The brain of the beholder. In R. Gregory, J. Harris, P. Heard and D. Rose (eds) The Artful Eye. New York:Oxford, 66 - 94.
Livingstone, M. and Hubel, D.(1995) Through the eyes of monkeys and men. In R. Gregory, J. Harris, P. Heard and D. Rose (eds) The Artful Eye. New York: Oxford, 52 - 65.
Mach, E. (1959) The Analysis of Sensations (trans) New York: Dover.
Sekuler, R. And Blake, R. (1994) Perception, 3rd Ed., New York: McGraw-Hill.
Shapley, R. (1996) Art and perception of nature: Illusory contours in the paintings of Ellsworth Kelly. Perception, 25, 1259 - 1261.
Solso, R. L. (1994) Cognition and the Visual Arts, Cambridge, Mass: MIT.
16