


Rita Luppino is an environmental intern at Anvil Knitwear Inc. She joined the Anvil team for events surrounding the 40th anniversary of Earth Day in the spring of 2010 and assisted in the online composition of Anvil’s first Corporate Social Responsibility report. Currently, Rita is completing her final year of graduate studies at The New School in New York City. She is pursuing a Master of Science degree with a concentration in sustainable management and social entrepreneurship. Rita is inspired by individuals and organizations that are spreading the message of change, collaboration, and sustainability in the 21st century.

Paula Bonanno is a fashion merchandising major at the University of Delaware. She is in the University Honors Program and has taken part in many projects at UD, including this Anvil carbon footprint assessment. Although she is a merchandising major, she also has an interest in design, specifically accessory design, and is particularly interested in sustainable design.

Stacey Lipschitz is an Honors Program student at the University of Delaware, where she is majoring in apparel design with a minor in interactive media. She has had three fashion design internships in New York City and is a recipient of the YMA Fashion Scholarship Fund. She is also involved in a grant project, funded by the Environmental Protection Agency, with Prof. Huantian Cao, Paula Bonanno and two other students.

Dr. Huantian Cao is an associate professor in the Department of Fashion and Apparel Studies at the University of Delaware. His research interests include textile science, protective clothing, and sustainable apparel design and production. His research has been funded by the National Science Foundation, the U.S. Environmental Protection Agency, and the Oklahoma Center for the Advancement of Science and Technology.
Textile and apparel production emits a large quantity of greenhouse gases (GHGs) in many phases of the product life cycle from the growth of cotton through textile manufacturing and dyeing to consumers’ care. To help solve these problems in the long term and provide better training for future industrial leaders, it is necessary to incorporate carbon footprint assessment into apparel design and merchandising curricula. Therefore, our future industrial leaders will be able to make more informed decisions in apparel design, production, sourcing, retailing, using, and reusing/recycling.
However, due to the complexity of the apparel supply chain and lack of transparency in many phases of textile and apparel production, it is very difficult for college students majoring in apparel design and merchandising to have hands–on experience in apparel carbon footprint assessment in their coursework. Recently, the Department of Fashion and Apparel Studies at the University of Delaware (UD) established a university–industry collaboration with Anvil Knitwear Inc. A group of students majoring in apparel design and fashion merchandising at UD are able to study Anvil’s carbon footprint assessment of its products. Anvil’s carbon footprint assessment and UD students’ learning experience are discussed in this article.

Carbon Footprint Assessment by Anvil Knitwear
Establishing a low–carbon sustainable world requires business leadership and innovation to address the problems surrounding climate change. As a significant manufacturer and supplier of sustainable sportswear, Anvil Knitwear is committed to analyzing the environmental impact of its apparel. Anvil is ranked by the Organic Exchange as having the sixth largest organic program in the world and is the largest buyer of U.S.–grown organic cotton.
In order to provide product transparency and manage its carbon footprint, Anvil enlisted GHG practitioner Camco International to quantify the emissions impact associated with the production, use, and disposal of four select T-shirts: Anvil® Basic, AnvilOrganic®, AnvilRecycled™, and AnvilSustainable™. A carbon footprint is a measurement of all greenhouse gases that are produced as a company in units of tons (or kilograms) of carbon dioxide (CO2) equivalent. The assessment of the life cycle for each Anvil T–shirt has been conducted in accordance with the guidelines and reporting principles provided by the World Business Council for Sustainable Development (WBCSD) Greenhouse Gas Protocol. In addition, the carbon footprint of the AnvilSustainable™ T–shirt was conducted in accordance to the WBCSD/ World Resources Institute Product Life Cycle Draft Standard.
As a vertically integrated manufacturer, raw data from Anvil facilities was used, as well as business related operations from third–party vendors. This information is pertinent to understand the life–cycle analysis (LCA) of a product because each stage of production and transportation is associated with energy consumption, water utilization, and waste output. Emissions data from all facilities included the production of energy, raw materials and fuels, waste disposal and transportation, purchased electricity and steam, water treatment, stationary combustion, fossil fuel production, transportation from imports and exports, employee commuting, and business travel.
Furthermore, the LCA acts as a tool for identifying cost savings opportunities, incorporating impact decision making on the supply chain, and demonstrating corporate responsibility initiatives. While Anvil primarily sells blank T–shirts, the LCA also accounts for screen–printing, machine washing and drying, and the disposal of the shirt. In order for Anvil to better comprehend the impact of materials used in production, the more detailed “cradle to grave” product comparison was used. This describes GHG emissions by the following six segments of the tees’ value chains: raw materials, manufacturing and warehousing, transportation, screen–printing, consumer use, and disposal.
These segments are further broken down by emissions associated directly and indirectly in the production and manufacturing stages of the given tee. For instance, the raw materials segment gathers GHG emissions data from the chemical and dye process, thread production, yarn production, and cotton farming and ginning. Each segment’s overall emissions are addressed in total amount of CO2 per tee and are then compared to the values from the other tees. As demonstrated in the chart below, emission–contributing activities are displayed graphically according to tee type.

Emission Profile Comparisons of Four Tees Note: Background emissions are included in the most recently analyzed tee, the AnvilSustainable™, in an effort to determine the impact of activities indirectly related to the production of the tee. Background emission sources include employee commuting, energy consumption of supporting offices, and business travel.
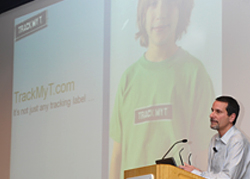
As evident in the chart, the most energy–intensive stage associated with a T–shirt comes from consumer usage. Approximately 60 percent of the overall emissions are associated with how it’s worn, washed, and dried over a lifetime. With this understanding, Anvil created TrackMyT.com, an interactive website that teaches consumers about the carbon footprint of their clothing, from cottonseed to closet. The site allows users to input a unique tracking number printed on a label sewn into their shirt’s inside bottom hem and then explore cotton farms, a gin and spinners, as well as Anvil’s textile mill, cut and sew plants, and distribution facility, where it was constructed and shipped.
Most importantly, TrackMyT educates visitors about how they can reduce their carbon footprint. For example, using cold water in the washing machine once a week will shrink your footprint by 275 pounds each year. By eliminating the drying process and letting your shirt air–dry, an additional 200 pounds of carbon per year will be reduced.
In the end, Anvil’s LCA shows that the AnvilOrganic® short–sleeve, 5.0 ounce, 100 percent organic tee possesses the smallest carbon footprint, with 3.09 kilograms of carbon dioxide equivalent. The AnvilSustainable™ tee shows a 15 percent lower footprint than Anvil’s conventional cotton tee, with each tee saving approximately three plastic bottles from going into a landfill. The LCA also illustrated that the majority of energy consumed during the making of a tee is expended at the textile mill, where yarn is knit into fabric, then dyed and finished.
The results from the LCA helped move Anvil’s corporate responsibility initiatives in areas that can have the most impact for the next assessment and for years to come. Pushing the innovation envelope and rethinking the way that tees are produced to better benefit the environment are necessary strategies that Anvil will incorporate into the future. For more information about Anvil’s social, environmental, and product responsibility platform, visit AnvilCSR.com.
UD Students’ Learning Experience
The purpose of the students’ carbon footprint study with Anvil was to look at the environmental impact data of Anvil’s T–shirts so the students could understand where the numbers and calculations come from, what the data means, and how they can apply the data collection process to analyze the impact of other apparel products. First, the students were given long packets of data for three of Anvil’s T–shirts, which listed the specific amounts of energy used in every aspect of the garment’s life cycle.
Due to the wealth of information, the faculty adviser and students chose to focus on the textiles manufacturing phase of the life cycle, so the students extracted all of the relevant textiles manufacturing data from the packets. From this data, the students were able to develop questionnaires containing all the questions necessary to ask manufacturing plants and factories about their energy usage in order to ascertain the overall impact of the textiles manufacturing of a specific product.
After coming up with this questionnaire, the goal was to have other students continue on with more research, giving future students a good base on which to embellish. By using real–life data, the students were able to apply the concepts they had learned in the textiles courses to an actual situation. This helped them understand where the information they were being taught was coming from and what questions would need to be asked if they were to have a career path in sustainability. The students hoped that starting this project would enable other students to have the opportunity to use the questionnaire to actually obtain information from a real manufacturing facility. The students believe that they were very fortunate to have the opportunity to work with Anvil and use real data to see the effects of T–shirt production with their own eyes.
