Group Members ________________________
________________________
________________________
________________________
________________________
Important - Please read this before you turn the page.
Write your name on each page.
You may refer to your notes, course reader, handouts, or graded homework assignments. Reference books in the course library may be consulted briefly and returned..
Please read the question carefully and make sure that
you have thought it through with everyone's input before converging on
a solution.
1. (12 Points) None of the detail of Figure 2 is preserved in the microfilm source from which the Svedberg and Fåhraeus article was copied. Based on the information in the article and the context, draw what you think Figure 2 should look like. Briefly describe how you arrived at your answer. Also, give the figure a title and provide any explanatory labeling of the sort you would like but was omitted on other figures in the article.
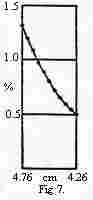
2. (13 Points) Consider the Figure 7 below from
Svedberg and Fåhraeus (1926) which shows the concentration of hemoglobin
as a function of the distance from the center of rotation in a centrifuge.
What would the profile look like if hemoglobin had a molecular weight of
16,700 rather than 66,800
and the rotational velocity were
doubled? Draw a line on the figure representing your conclusion and justify
it in words.