CHEM-342
Introduction to Biochemistry
Group Members ________________________
Final Examination - Group Part
Tuesday, 21 May 2002
________________________
8:45 - 10:00 PM
H. B. White - Instructor
________________________
________________________
Important - Please read this before you turn the page.
-
You must sign your name on this page to receive the
group grade.
-
You may refer to your notes, course reader, handouts,
textbook, or graded homework assignments. Reference books in the course
library may be consulted briefly and returned.
-
In CHEM-342, hemoglobin is a vehicle for learning how
to learn by asking questions and pursuing answers to those questions. Undoubtedly
you have learned a lot about hemoglobin in the process but you also should
be developing habits of mind that will enable you to solve problems in
other courses and throughout your life. This part of the final examination
provides an opportunity for you and the other members of your group to
display problem-solving skills as a team. It is extremely unlikely that
anyone in your group or in the class has encountered the information on
the following page. Your answers should display your collective:
-breadth of knowledge (not limited to hemoglobin or biochemistry)
-ability to analyze, make connections, and ask probing questions
-sense of logic and organization
-skill at generating models (testable hypotheses)
-
This examination should be approached
in phases
Phase 1 - Individual work for 10 to 15 minutes. Read the questions
carefully and write
down all of your learning issues and thoughts.
Phase 2 - Starting about 9 PM, as a group, generate as long a list
of learning issues as you
can. Organize your learning issues into five major categories and arrange
them to
display a probing series of connected questions.
Phase 3 - Generate a hypothesis provoked by the data and built around
one of your learning
issue categories. Make a prediction about the results of a test of your
hypothesis.
-
This examination will be evaluated on
the richness of learning issues, the depth of analysis, the presentation
of learning issues, and the quality of hypotheses and tests.
Iron Deficiency Anemia???
The atomic mass of iron is the weighted average of the
masses of its isotopes of which the four common non-radioactive ones are
listed below from the 77th Edition of the CRC Handbook of Chemistry and
Physics.
|
Isotope
|
% Natural Abundance
|
Mass
|
|
54Fe
|
5.845
|
53.939615
|
|
56Fe
|
91.754
|
55.934942
|
|
57Fe
|
2.119
|
56.935398
|
|
58Fe
|
0.282
|
57.933280
|
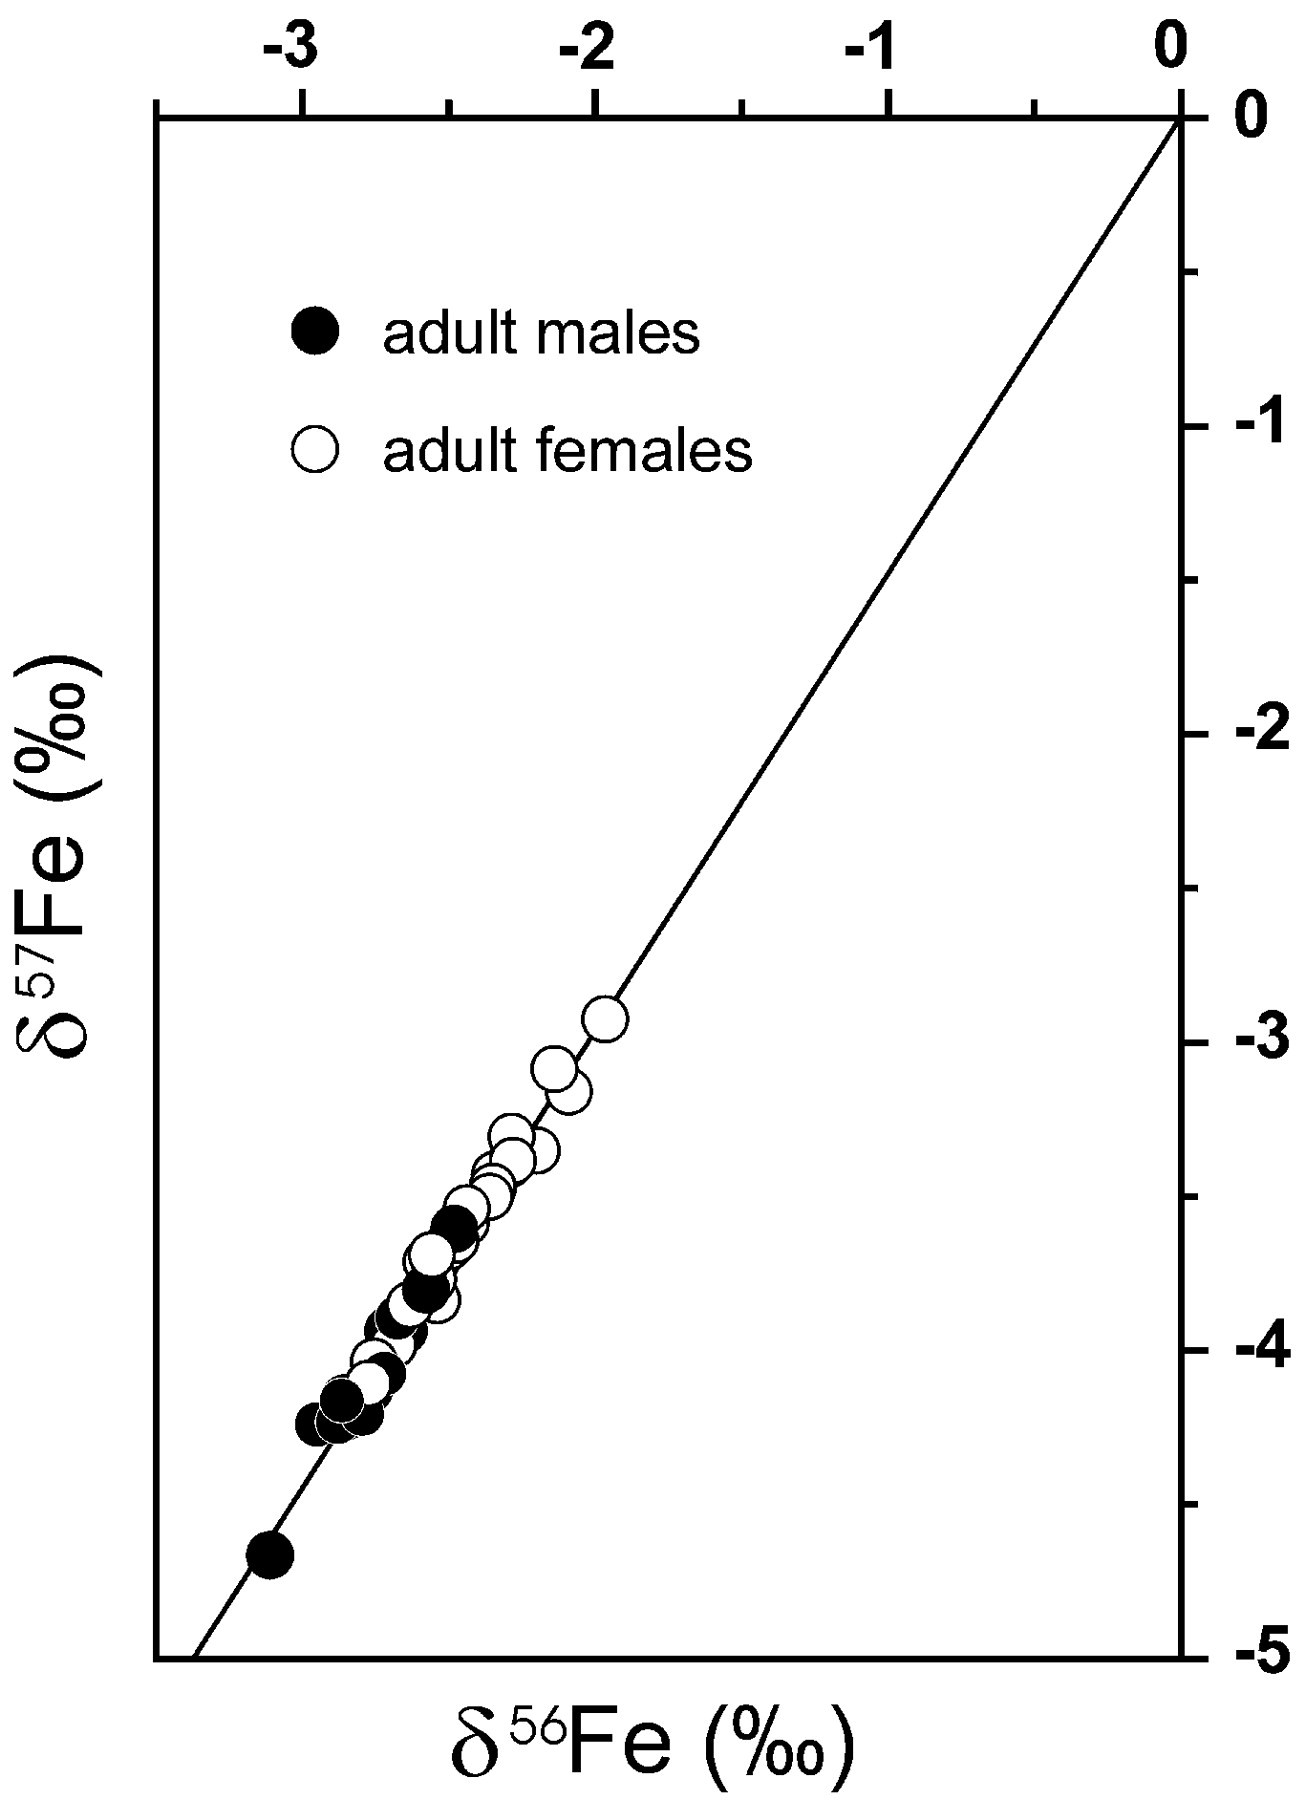
Mass spectrometry can measure the relative abundance
of each isotope in various samples with great accuracy and precision. Thus,
differences in isotope abundance among samples of as little as 0.01% can
be detected. The figure below was published about two months ago in Science
[1]. In a single graph it depicts the relative abundance of the three most
common iron isotopes in blood samples taken from 15 men and 29 women. For
example, a delta 57Fe
() value of -3 on the y-axis means that there is a 3 part per thousand
(0.3%) deficit of 57Fe
in an iron sample relative to 54Fe.
A reference standard with the natural abundances listed above would be
a point at the origin in the upper right hand corner.
 |
56Fe () ={ [(56Fe/54Fe)sample/(56Fe/54Fe)std]
1} x 1000
57Fe () ={ [(57Fe/54Fe)sample/(57Fe/54Fe)std]
1} x 1000
1. (15 points) After generating a significant list
of group learning issues on a separate sheet, organize the list into five
major categories and present them on the next page in a coherent way that
displays logic and depth.
2. (10 points) Generate a testable hypothesis built
around one of your learning issues and, based on your knowledge and intuition,
make a prediction of the outcome. |
[1] Thomas Walczyk and Friedhelm von Blanckenburg, Natural
Iron Isotope Variations in Human Blood, Science 295, 2065-2066 (2002)
Learning Issue Category 1 ___________________________________
Learning Issue Category 2 ___________________________________
Learning Issue Category 3 ___________________________________
Learning Issue Category 4 ___________________________________
Learning Issue Category 5 ___________________________________
Testable hypothesis generated by one category of learning
issues.
Prediction of the results of a test of your hypothesis.
Bonus Question
(5 points) Work on this problem only if your group has
finished the main problem. The average life span of a red blood cell is
about 4 months. Estimate to within one order of magnitude the number of
hemoglobin molecules your body makes every second.
Return to Hal
White's Home Page, Course
Home Page, or Departmental Home
Page.
Posted 23 May 2002 by Hal
White
Copyright 2002, Harold B.
White, Department of Chemistry and Biochemistry, University of Delaware