
Undergraduate Admissions

The future depends on vision. It requires imagining a new and better world and making that world flourish. It depends on students with drive and ambition taking on new challenges and seeing new opportunities—students like you. At the University of Delaware, we welcome visionaries, problem solvers, artists and dreamers. We welcome you.
-
Design a new tomorrow
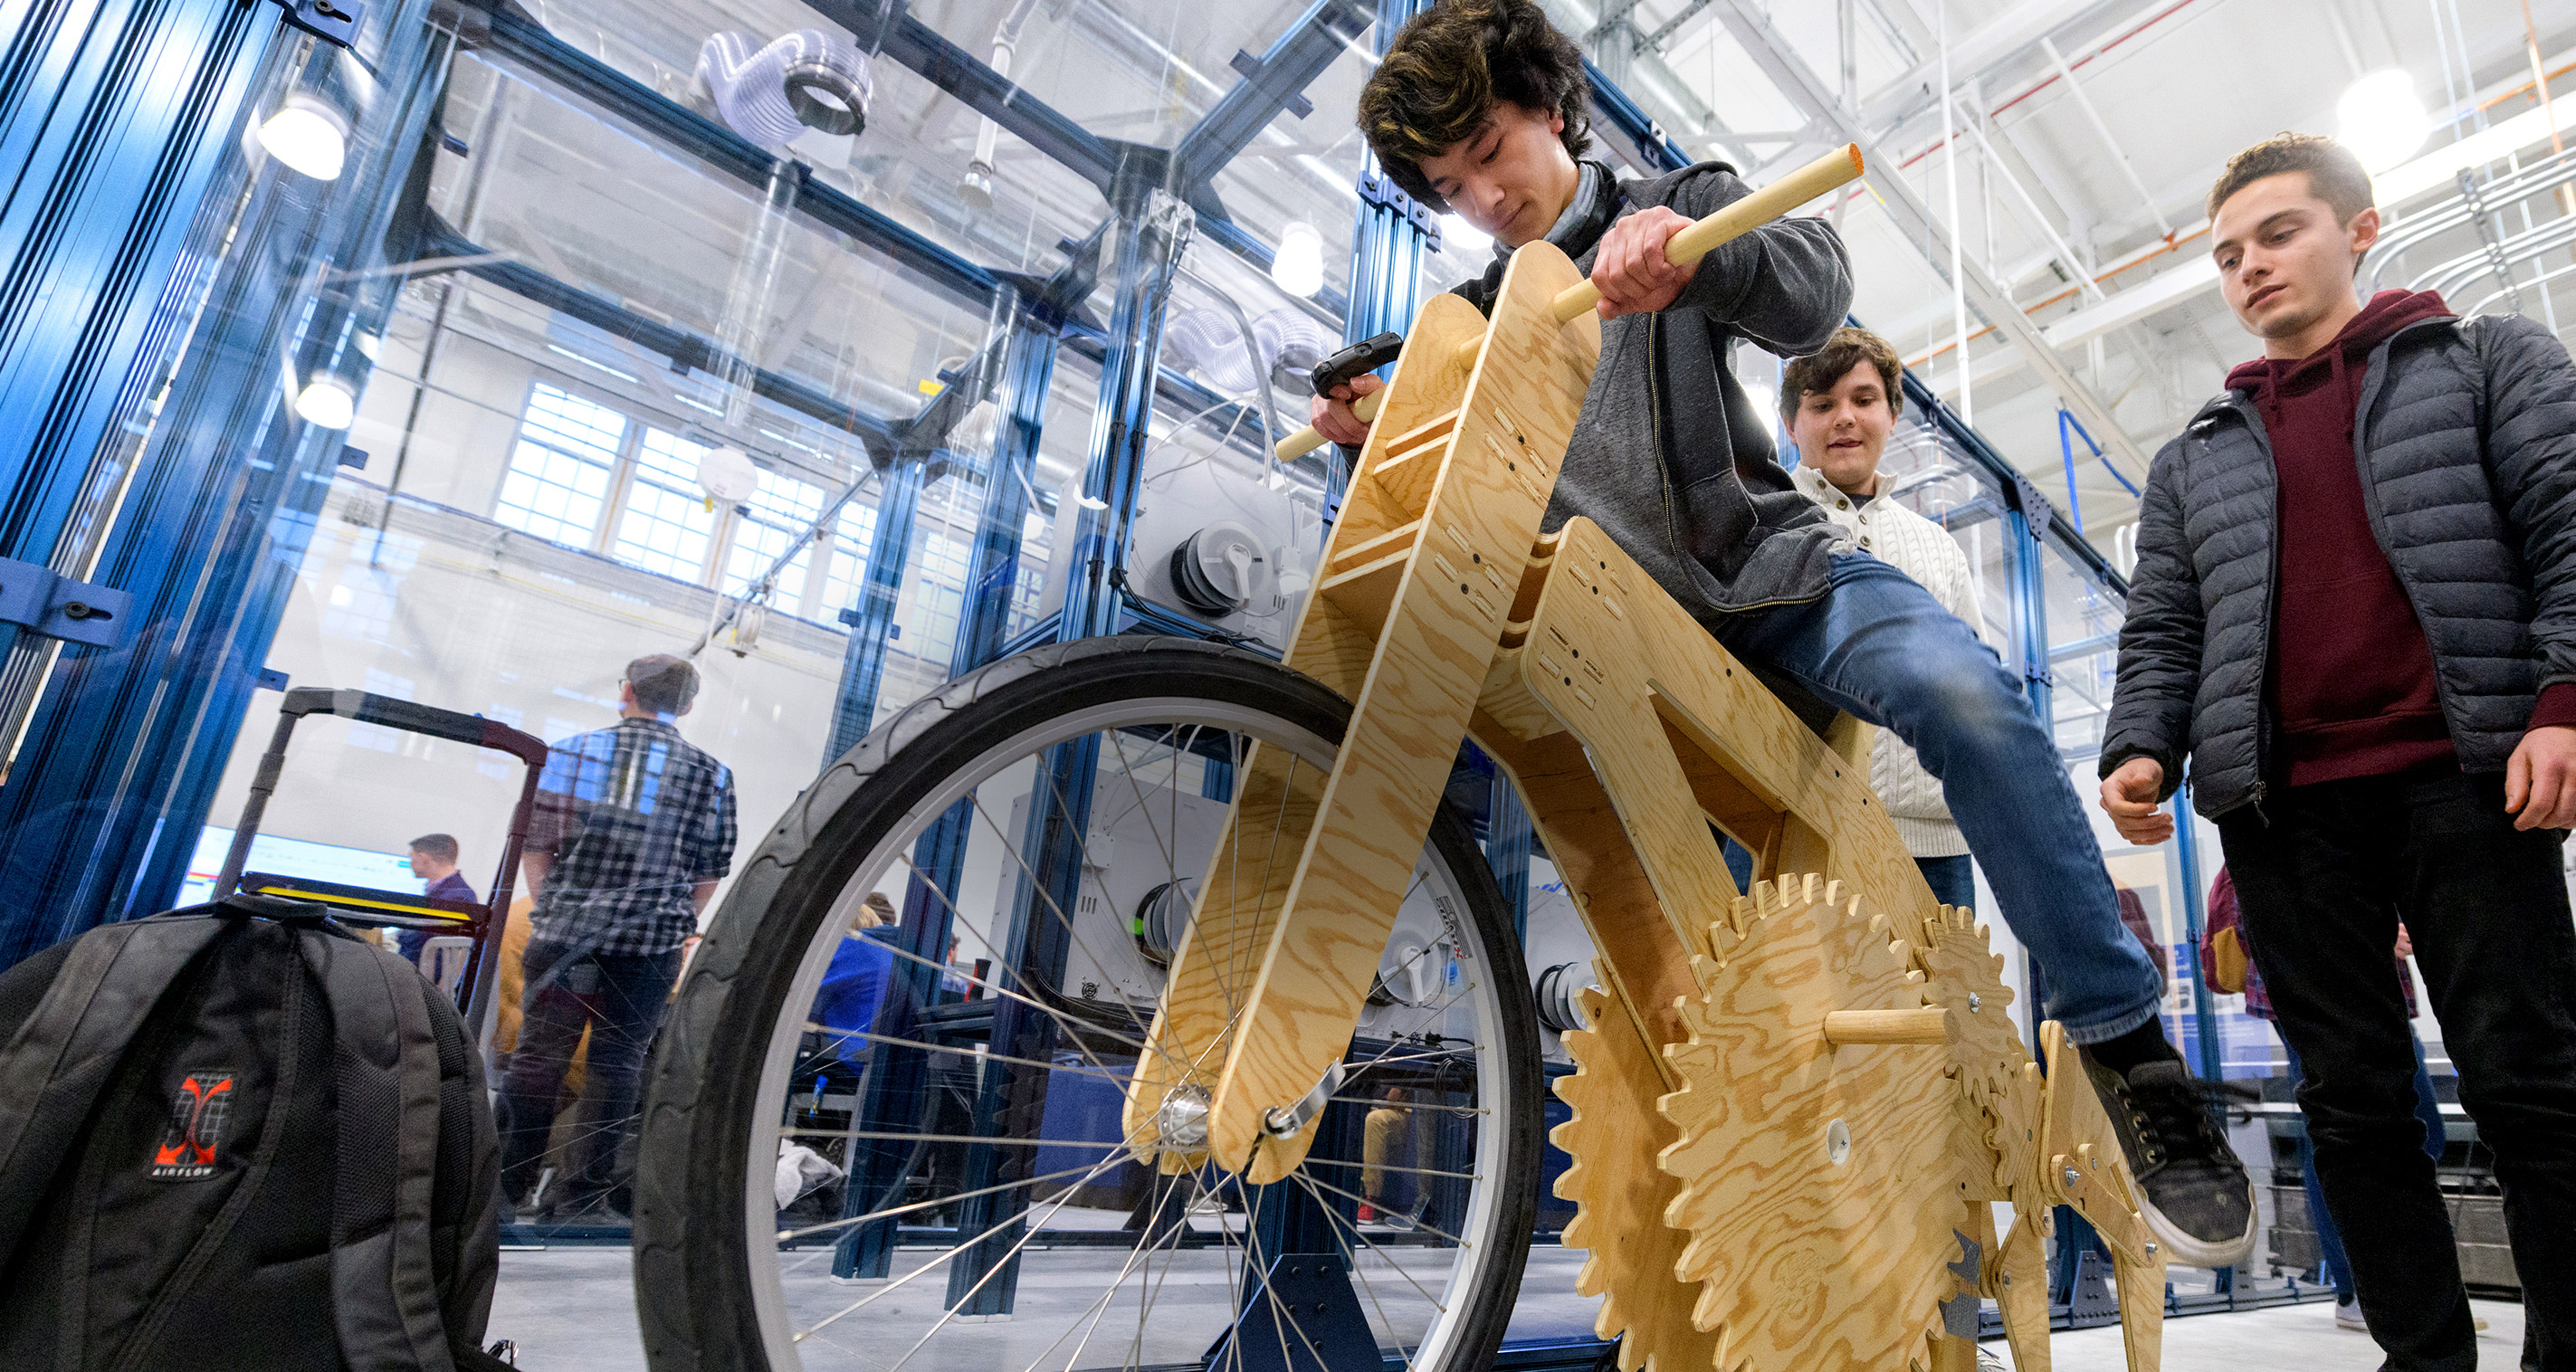
If you can imagine it, we’ll help you build it, giving you the knowledge to bring your ideas to life and the resources to realize your vision. In our labs, students have used computer models to assist in the fight against cancer. In the Venture Development Center, student entrepreneurs used 3D technology to help firefighters battle blazes. In the MakerGym, engineering students designed a biodegradable bicycle for a more sustainable future. What will you make?
-
Keep our community safe
If the health crisis that upended every country on the globe taught us one thing, it’s that there’s still work to be done. And the students and faculty at UD are doing it. They’re studying faster ways to get medicines to patients; they’re examining the molecular structure of viruses; they’re designing new treatments and new ways to serve people in crisis.
-
Making a just world
A pessimist might say that there’s always been injustice and there always will be. At UD, we’re not pessimists. Where we see injustice, large and small, we ask: What can we do to change it? What can we do to make our society more equitable? The answers our students and faculty have come up with might surprise you.
-
Protect the environment
The problems our environment faces are large. That’s why it takes all of us at UD to chip in. We need students in every field to bring their unique skills to the table. We need policy analysts to craft smart legislation, writers and artists to spread the word, teachers to inform the next generation and entrepreneurs to build sustainable businesses.
-
Find your path with the AAP
At UD, we believe that a quality education should be affordable. That’s why our Associate in Arts Program (AAP) offers a cost-effective path to a UD degree for Delaware residents. With small class sizes, dedicated UD faculty and the SEED Scholarship that covers most students’ tuition for up to three years, the opportunities are endless. Our graduates have gone on to become educators, nurses, academics, business owners and much more. Where will the AAP take you?
UD Facts and Figures
-
Undergraduate Admissions | University of Delaware #36
Top Public National Universities
-
Undergraduate Admissions | University of Delaware #109
Best Value Schools
-
Undergraduate Admissions | University of Delaware #5
Chemical Engineering Program
-
Undergraduate Admissions | University of Delaware #45
Best Colleges for Veterans