Asthma in New York City
Synoptic Climatology Lab
Center for Climatic Research
- University of Delaware
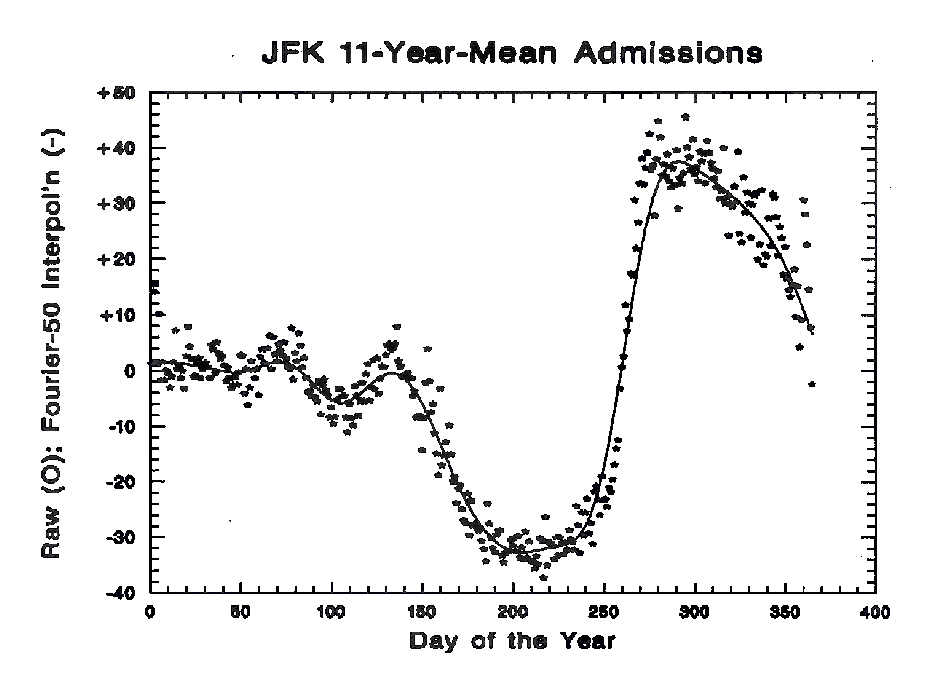
The following graph indicates the variation in hospital asthma admissions over the calendar year. These data represent 11 year daily averages that have been standardized by yearly mean. Standardization was necessary due to the sharp rise in admissions through the period of record.

Data points are daily averages; the curve is a Fourier Transform designed to smooth the data for dependent variable analysis. By looking at each day in the period of record compared to its smoothed curve value, it is possible to identify which days were exceedingly high above their expected value.