
As part of the project but not reported here (Field and Philipp, 2000) we undertook a preliminary analysis of wetland vegetation in relation to flood frequency and duration. Water level recorders were operated at a number of locations between Big Stone Beach Road and the canal breach between September 1999 and March 2000 in an effort to characterize the tidal forcing in the vicinity of Greco’s Canal and assess the relation between vegetation type and tidal inundation. Marsh surface elevations of vegetation types and transitions between types were surveyed in order to relate the tide inundation to vegetation type.
Here we focus on the classification of the wetland vegetation from the hyperspectral imagery, illustrate some wetland habitat types and illustrate some of the wetland change that has occurred within the past 30 years. Emphasis has been placed on examining that portion of the tidal wetlands lying between Bennetts Pier and the Mispillion River, with particular attention to wetlands east and west of Greco’s Canal (between the vicinity of Big Stone Beach Road and Rawley Island) which have been subject to increased inundation during the last decade and a half. It is in this area that we have concentrated our attention to on-the-ground observations to support our wetland map interpretation.
Atmospheric conditions on 25 September were excellent for remote sensing throughout the time of the observations. There were no clouds. Atmospheric humidity and haze were low: air temperature about 25 C and the dew point about 15 C. The aircraft altitude was 2000 meters in order to achieve a ground resolution distance (pixel size) of 2 m by 2 m. The study area was covered by 26 flight strips, oriented in a north-south direction, starting on the east with strip 51 at 10:09 EST and flying the last strip on the west, number 1 at 14:17 EST. The AISA spectrometer was configured to record 30 spectral bands between 450 and 850 nm (Appendix I). The gain of the shorter wavelength bands was increased to compensate for lower sensor sensitivity in that spectral region. Using downwelling solar radiation collected at the aircraft, target spectral observations were converted to apparent reflectance.
Preparation of the Image for Analysis
The image was georeferenced to UTM zone 18 meter WGS 84. The flight strips were each georeferenced during acquisition. A differential GPS unit incorporated with the spectrometer provided geographical coordinates for the spectrometer scans. An inertial unit recorded aircraft motion data to allow post flight correction for aircraft pitch, roll, and yaw. The georeferencing of the data as delivered by the vendor was found to be accurate to about 10 meters. We performed subsequent image processing and analysis using the ERDAS Imagine v 8.4 software package. The flight strips were individually georeferenced to Delaware one meter 1997 orthophoto quarter quadrangles, also UTM zone 18, using road intersections where available and mosquito grid ditch intersections in the marsh. (We have found the position of the grid ditches to be very stable through time by comparing T sheet ditches mapped in 1969 with the 1997 digital orthophotos.) The nearest neighbor resampling was employed in georeferencing.
The image strips were assembled into a mosaic of the study area using image matching in the overlap portions only. (Pixel values are not changed from those in the original flight strips except for slight changes in brightness to feather-match overlaid pixels in the overlaped areas.) The size of this image file exceeds 3 gigabytes.
The accuracy of the georeferencing of the final image is confirmed to be within the 2 to 4 meters by comparison with several points surveyed in conjunction with this project by Taylor Wiseman Taylor Engineers which have a horizontal accuracy on the order of 1 cm and with 18 positions which we established with GPS on road intersections.
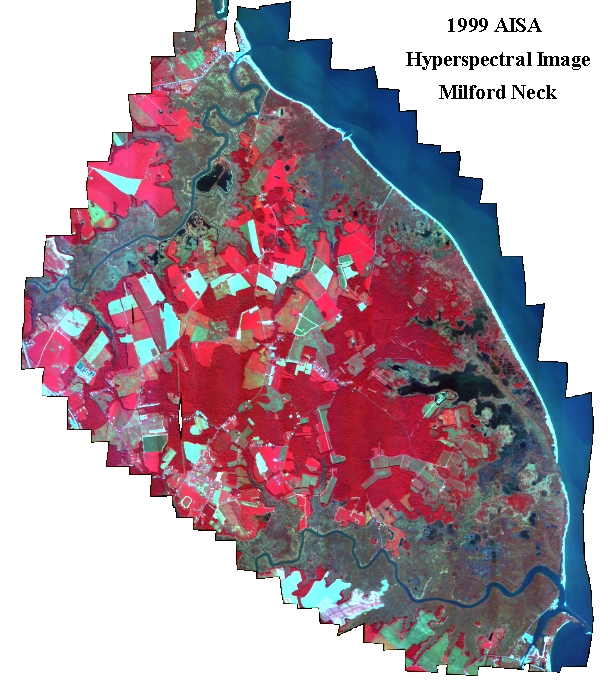
A 3 band image (bands 30, 19 and 4 in the infrared, red, and blue spectral regions respectively) of the Milford Neck area is shown. Red color displays the infrared band and blue the blue band. The whole 30 band data set of apparent reflectance values was used to generate a classified image of the land cover/vegetation of the area. The southeast quarter of the study area is also shown enlarged.
A correction for atmospheric haze was not applied prior to classification. Subsequent classification tests on a haze corrected version of the wetland image data substantiated the assumption that spectral separation of the wetland vegetation species would not be improved by haze correction. (Appendix II discusses preparation of a haze corrected image of the study area from this mosaic.)
Comments on Data Quality
While in general the quality of the observations is high and atmosphere was sufficiently clear that Rayleigh scattering alone describes the atmospheric contribution to the observed reflectance values (see haze correction discussed in Appendix II), there are several noise effects to be noted which remain in the data prior to classification.
|
1) Band 1 of the western most flight strip (flight strip 1) is excessively bright in comparison with the other flight strips. Band 1 for this strip cannot be used in classification. 2) Flight strip 11 exhibits some kind of patterned noise problem with the scanner or georeferencing in two areas just north of the Murderkill River. This effect is expressed across all bands. 3) The short wavelength bands 1 through 6 (especially bands 1-4) show a considerable amount of noise. This results from increasing the sensor gain to compensate for lower sensitivity of the CCD sensor array in this spectral region. An occasional noisy pixel can be observed at longer wavelengths. These noisy pixels are independent from band to band. Experiments with low pass filtering to reduce this noise did not appear to improve the ability to separate vegetation species. Consequently the unfiltered data were included used in the classification. 4) The flight tracks can be seen in the mosaic to show a slight along-track banding on both margins between strips. The individual strips, especially in the shorter wavelengths, can be seen to have a darkening along the edges which is usually stronger on one side than the other. This banding does not appear to be related to orientation of the flight line with respect to solar position. Flight lines to the east of the approximate center of the image were made prior to solar noon and lines on the west side of the image were made after solar noon. The darker edge appears alternately on the eastern and western sides of adjacent flight strips, regardless of time prior to or after local noon. Thus, the explanation is likely to be an instrumental effect unrelated to atmospheric or other external optical effects. The banding is exhibited primarily in spectral bands 1 through 10 as an asymmetrical “rolloff” (or decrease) in scene reflectance over about one quarter of the scan on one side. It is most noticeable in the water reflectance. The magnitude increases with distance from the center of the flight strip to a maximum loss of about 13% for bands 1 to 7 and about half of that for bands 8 through 10.
|
Observations of Ground Conditions
Current observations of actual land cover are essential to successful classification of the image data. We obtained observations of ground conditions in two ways. Oblique photographs using hand held 35 mm cameras from low altitude aircraft were obtained on 18 September, 1999, 28 May, 2000, and 19 April 2001 documenting conditions of early senescence, pre “green-up” and early spring ”green-up.”
The oblique aerial photography was undertaken through a standard 50 mm lens at two scales: an overview of the area (for orientation) from an altitude of about 900 m (3000 ft) and detail views from an altitude of about 300 m (900-1000 ft). Color print film with an speed rating of ISO 200 exposed through polorizer and UF filters and printed at 4" by 6" provided clear, sharp resolution of features on the ground. The over two hundred color prints obtained proved to be extremely useful in identifying locations of Salt Hay licks, Phragmites stands and areas of dead Phragmites canes. The photography in May was especially helpful in identifying high tide bush as it showed bright green against the dark marsh surface.
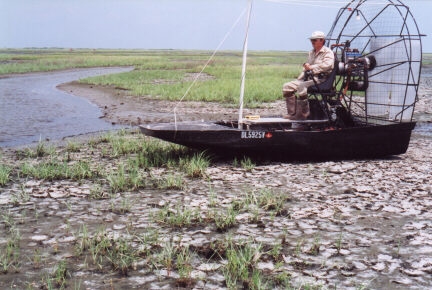
In addition to the aerial views, actual ground visits were also necessary. These were undertaken with GPS equipment to establish specific point and polygon targets of identified vegetation cover with which spectral signatures at known locations in the imagery could be associated. Access deep into the marsh was extremely difficult. Much of the area is remote from firm ground and overland walking is blocked by ditches, open water or deep mud. The shallow water and soft mud of the lagoon severely impedes access to the interior by outboard motor boat, canoe or ARGO tracked vehicle. Visits had to be scheduled in accordance with favorable tide conditions. Consequently, until June, 2000 our access was limited to the immediate vicinity of Greco’s Canal. In June, 2000 Wetland Research Services acquired an air boat which we used to gain access to the extensive shallow water and mud flat areas of the interior of the marsh. Ten visits to obtain ground truth observations (Appendix III) were made between January and October, 2000.
Water standing on the marsh significantly affects the observed spectra of vegetation communities. Inferences from spectra about marsh vegetation cover and community structure or comparison of marsh at different times require a consideration of water depth. Since tide levels are irregular functions of time, the water level on the marsh at the time of the flight should be known. The flight on 25 September, 1999, was made 10 days after hurricane Floyd. The highest water level associated with the hurricane observed in Greco’s Canal at the Bridge on Big Stone Beach road was 0.72 m on 16 September. This was about 10 cm higher than the elevation of S. alterniflora marsh near the bridge (see Field and Philipp, 2000 for a discussion of marsh elevations). On the day of the flight the tide level observed in Greco’s Canal at was high at 0912 EST at 0.59 m and low at 18:24 at 0.48 m. Tide level thus fell gradually from 0.55 m at 10:00 to 0.49 m at 14:00. These water levels in the lagoon and on the marsh in the vicinity of Greco’s canal were not sufficiently high to flood the salt hay and S. alterniflora marsh in the vicinity of the bridge. This is important to note in connection with interpreting the image data because during some subsequent on-the-ground visits for ground truthing the tide level on the marsh was substantially higher and sufficient to flood salt hay areas under 10 to 30 cm of water and even deeper in areas of S. alterniflora. The experience of those visits would give a wrong impression of marsh conditions prevailing at the time of the flight.