The reflectance spectrum, obtained by dividing the upwelling spectral energy from the target by the spectral energy downwelling on the target, is characteristically primarily dependent on optical properties of the target material and generally somewhat dependent on the geometry of the sun-target-sensor system. Variability due to geometry can be kept small by restricting observations to nadir observing sensors within an hour or two of local noon.
Radiation of particular wavelengths passing through the atmosphere is subjected to a number of interactions with the atmosphere: forward and back scattering, refraction, and absorption. Correcting the received signal for all of these effects generally requires more knowledge of local atmospheric conditions than is available. Simultaneous reference observations on the ground can be helpful in defining the needed corrections.
In an airborne imaging system, recording the spectrum of downwelling solar radiation at the sensor level allows computing an apparent reflectance of the target which reduces the impact of a number of the atmospheric effects. However, back scattering by atmospheric particles between the aircraft and ground target still contributes significantly to the signal received at the aircraft. This results in an additive error in the target reflectance which may be written
Lg is the radiance at the aircraft received from the ground Latmos is the radiance at the aircraft backscattered by the atmosphere below the aircraft Ldown is the radiance at the aircraft received from the sun and atmosphere above the aircraft. |
The last term on the right represents the component of the apparent reflectance due to atmospheric haze between the aircraft and ground. When it can be estimated it can, as a first order correction, be subtracted from the apparent reflectance.
The magnitude of the backscattering by haze particles varies with wavelength of the light and depends on the size of particles with respect to the wavelength. For particles significantly smaller than the wavelength of light Rayleigh scattering dominates and scattering is inversely proportional to the fourth power of wavelength. This condition predominates when dust and moisture particles are of very low concentration and accounts for the blue color of the sky. As concentration of larger particles, on the order of the wavelength of light, increases Mei scattering becomes increasingly important. Here scattering is inversely proportional to smaller powers of wavelength and approaches wavelength independence for particles of a size greater than 10 times the wavelength. (See Slater et al. 1983)
Accordingly, if one can estimate the amount of haze back scatter at one waveband in an image one can apply these relationships to calculate a haze correction for all wavebands. Chavez (1988, 1989) has described such a technique.
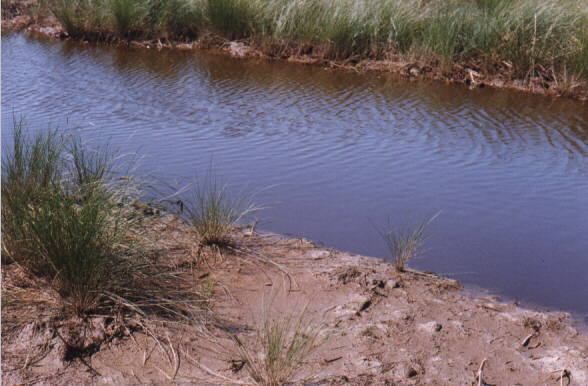
We have on-the-ground observations of reflectance of clear water in a recently dug
open-marsh water- management (OMWM) channel at Milford Neck taken two days prior to the
AISA overflight. This OMWM channel, shown in Figure 19 was constructed a
month or two prior to these observations, as evidenced by the surrounding dry mud surface. The
median observed reflectance curve, resampled to correspond with the AISA wavebands, and
compared with the apparent AISA reflectance for a nearby large body of water in Figure 20. In the visible portion of the spectrum the difference between these two curves is
primarily due to the reflectance of the atmosphere. This atmospheric backscattering can be
approximately modeled according to a model based on one of the exponents shown in Table 1.
Selection of an appropriate exponent to fit the haze conditions can be made by comparing the
results of trial values of x with the observed haze reflectance values. Taking the difference
between apparent reflectance observed in the AISA image and the reflectance observed in
ground observations as ![]() atmos, alternative haze reflectance models may be scaled according to
atmos, alternative haze reflectance models may be scaled according to
|
|
After applying an x = -4 haze correction to the whole AISA image the resulting apparent reflectance of this OMWM ditch and the nearby large expanse of lagoon water are compared in Figure 22. Note the generally brighter values observed at the aircraft level for water in the OMWM ditch. This provides an illustration of the adjacency effect mentioned as a potential source of classification error and provides an opportunity to illustrate the need to carefully select ground targets to use in calibration and training. While the corrected apparent AISA reflectance of water in the "Western Lagoon" agrees quite well with the on-the-ground observations of reflectance for the OMWM ditch, the corrected AISA apparent reflectance for the ditch is almost twice as large as for water in the "Western Lagoon." The probable explanation for this is light reflected from brighter adjacent marsh surfaces which has been scattered into these water pixels along the upward path to the aircraft. Thus ground targets used in calibration to be sufficiently large to avoid such contamination with light reflected from neighboring brighter, contrasting targets. Spectra of apparent reflectance taken from the haze corrected image for the marsh surrounding this ditch appear almost twice as bright as those from the water in the ditch.
In Figure 23 spectra of S. alterniflora from the haze corrected AISA image and two sets of ground observations are compared. The ground spectra are median values of two sets of spectra obtained at Cedar Swamp, Delaware on 23 August 1999 and at Milford Neck on 15 October 1999. The general agreement is striking. The sample from Milford Neck is of a less dense canopy which had begun to become senescent. Hence it shows less absorption in the red and reflection in the near infrared portions of the spectrum than the other two spectra.
